
Figure 6.
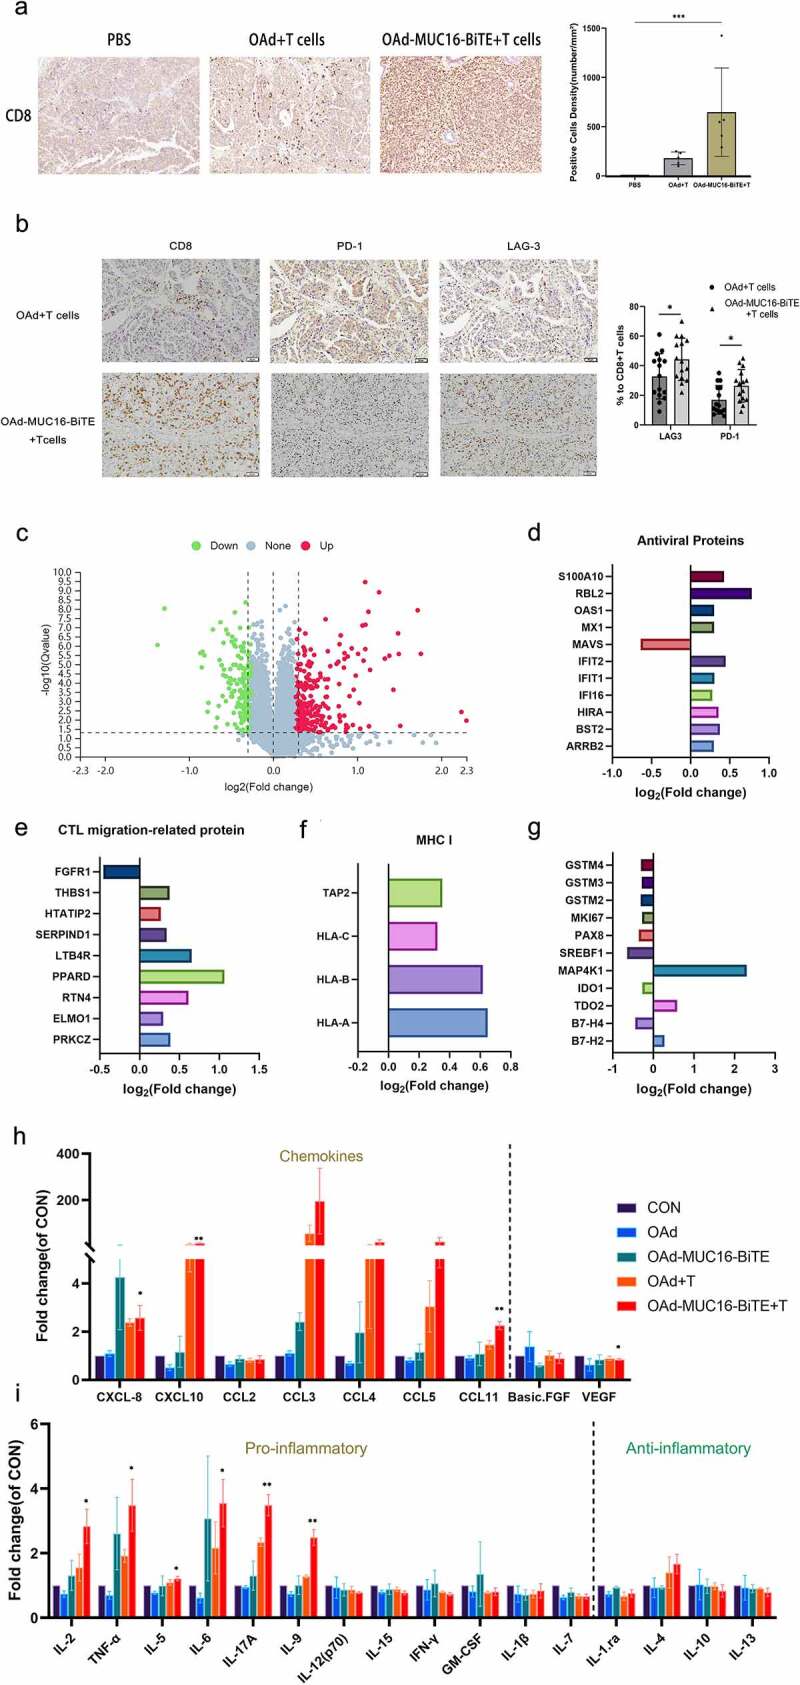
OAd-MUC16-BiTE increases T cell infiltration and reverses TME. (a) Representative IHC images showing CD8 lymphocytes in PDX tumors. Scale bar: 50 μm. CD8+ cell density (cells/mm2) of each tissue slice (n = 5) is shown right. Data are shown as the mean ± SD. (b) IHC of immune markers, CD8, PD-1, and LAG-3 in PDX tumors. Scale bar, 50 μm. Percentages of PD-1+ and LAG-3+ cells among CD8 + T cells are shown right. Number of positive cells from randomly chosen 5 fields/tumor section/mouse were counted, and the mean ± SD of all fields across the mice (N = 3/group) are presented. (c) Volcano plot of DEPs between the two groups (OAd-MUC16-BiTE + T cells vs. PBS). Each point represents a detected protein. The red dots indicate the upregulated proteins; green dots, downregulated proteins; and gray dots, non-significant DEPs. The thresholds for significant differential expression were set at q < 0.05 and fold-change > 1.2. DEPs related to antiviral activity (d), T cell migration (e), and MHC I antigen processing and presentation(f). (g) DEPs related to T cell function and platinum resistance. (h) Chemokines (left) and angiogenic factors (right). (i) Pro-inflammatory factors (left) and anti-inflammatory factors (right). (h, i) Data are shown as the mean ± SD in triplicates. DEP, differentially expressed protein; MHC, major histocompatibility complex; CTL, cytotoxic T lymphocytes; CON, control; CXCL, chemokine CXC motif ligand; CCL, chemokine C-C motif ligand; VEGF, vascular endothelial growth factor; FGF, fibroblast growth factor.