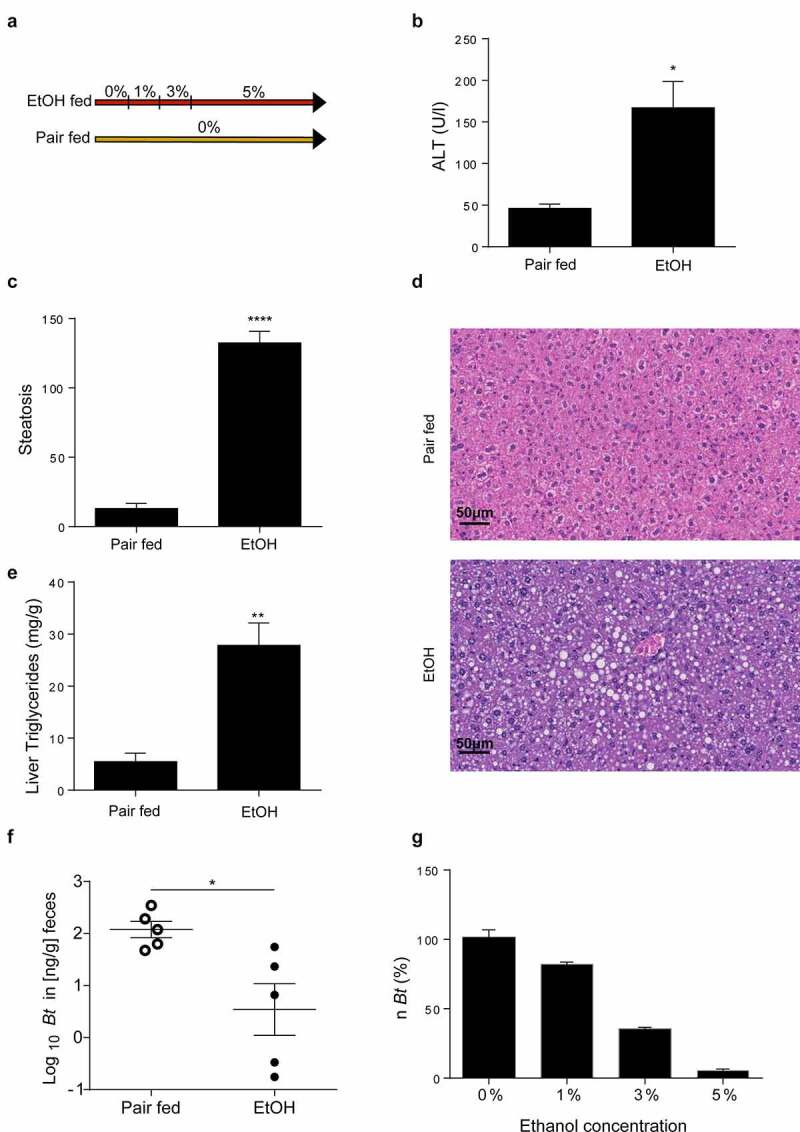
Figure 1.

Ethanol depletes Bt. (a) Design of Lieber-DeCarli model. (b) Serum ALT levels (Pair fed = n6; EtOH = n10). (c, d) Histological determination of hepatic steatosis with representative pictures of H&E staining (n = 5 per group). (e) Liver triglyceride content (Pair fed = n5; EtOH = n6). (f) Quantification of Bt DNA in feces measured by qPCR (n = 5 per group). (g) Quantification of Bt number (expressed in percentage) in LYBHI medium supplemented with different ethanol concentrations. Data are expressed in mean ± SEM; *p < .05, **p < .01, ***p < .001, ****p < .0001 according to two-tails student’s t-test.
Abbreviations: Bt, Bacteroides thetaiotaomicron.
