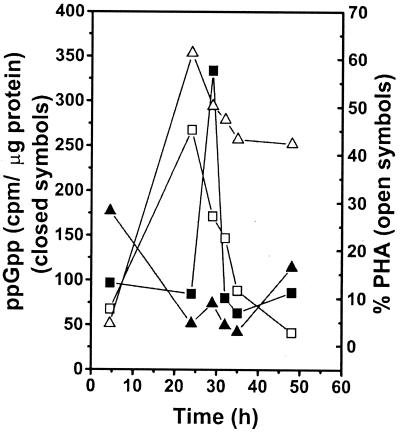
FIG. 5.
Intracellular levels of ppGpp and PHA content of P. oleovorans GPo1 (squares) and GPo500 (triangles). Cells were grown in 0.5 N E2P supplemented with 5 g of sodium octanoate per liter. Culture samples were analyzed for ppGpp and PHA content at the start of PHA degradation. Each value is the result of two determinations.

