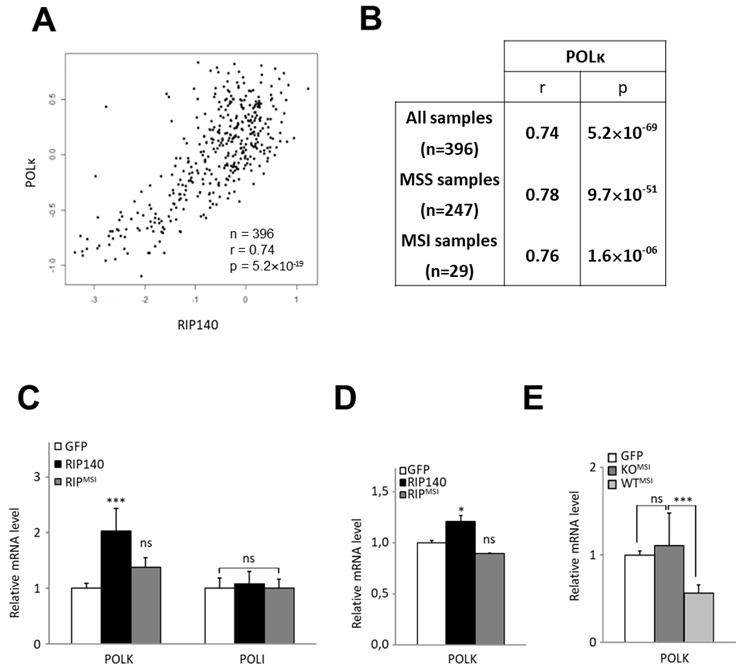
Figure 4.

RIP140 and POLK in MSI CRC tumors. (A) Correlation between RIP140 and POLK gene expression in 396 colorectal adenocarcinomas[34]. (B) Statistical significance was assessed using a Spearman correlation analysis on this cohort, containing 247 microsatellite stable (MSS) and 29 microsatellite instable (MSI) samples. Spearman correlation coefficients between RIP140 and POLK gene expression are indicated for the whole cohort, as well as MSS and MSI samples. (C) mRNA quantification of the POLK and POLI genes in MEF RIPKO stable cells expressing either the GFP (white box) or the GFP fused wild-type form (black box) or the RIPMSI mutant form (grey box) of RIP140. (D) mRNA quantification of the POLK gene in HT29 CRC cells transiently transfected with pEGFP, pEGFP-RIP140, or pEGFP-RIPMSI expression vectors. (E) Analyses of the mRNA expression of the POLK gene in MEFs cells stably transfected with the human expression vector of RIPMSI in a RIP140 wild-type background (MEF WT) or knock-out (MEF RIPKO) as compared to the control transfected with a GFP expressing vector in each condition. A Mann-Whitney test was used for statistical analysis (ns = not significant, *P < 0.05, **P < 0.01 and ***P < 0.001).
