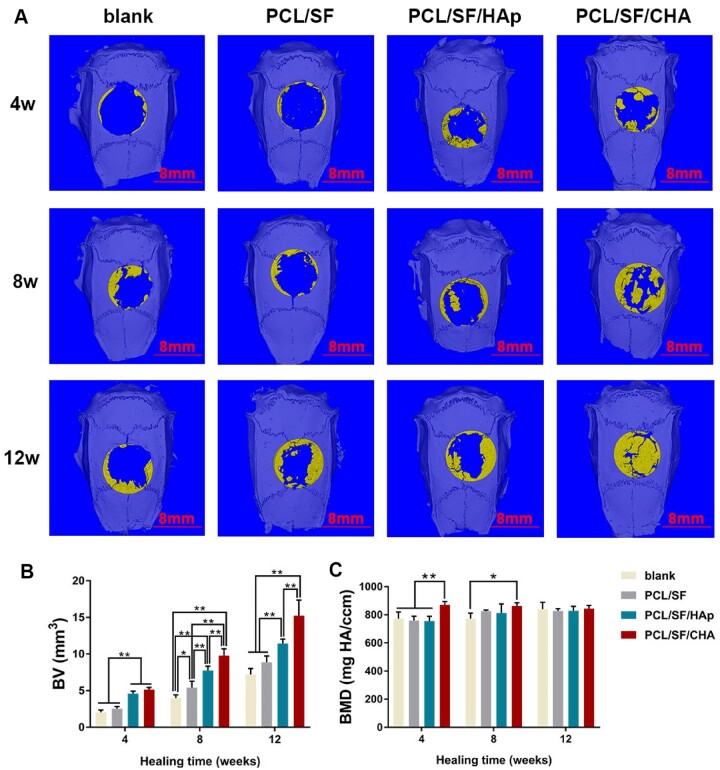
Figure 3.
Effects of bone regeneration after 4, 8 and 12 weeks of surgery (n = 5). (A) Micro-CT images of blank, PCL/SF, PCL/SF/HAp and PCL/SF/CHA groups after 3D reconstruction. Yellow represents new bone formation. The scale bar = 8 mm. (B) Bone volume (BV) changes during bone regeneration. (C) Bone mineral density (BMD) of four groups during bone regeneration. The P values represented by *P < 0.05; **P < 0.01; ***P < 0.001.

