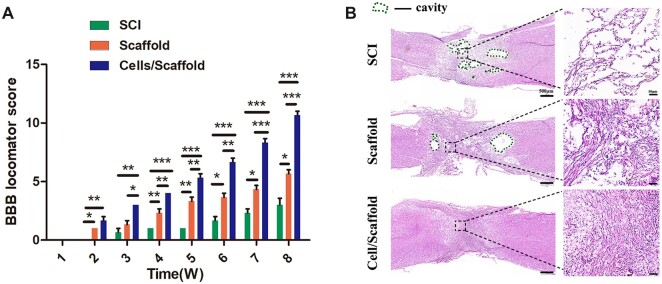
Figure 3.
Motor functional recovery and histological evaluation. (A) The BBB score analysis at indicated time points. Data were expressed as mean ± SD (n = 10). ***P < 0.001, **P < 0.01, *P < 0.05. (B) H&E staining of spinal cord tissues. The cavity area in the perilesional area in cells/scaffold group was significantly smaller than those in other two groups. The green dotted line indicated the cavity area.

