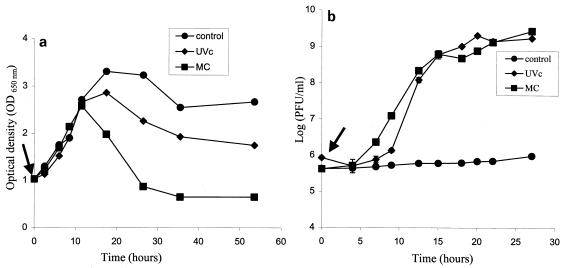
FIG. 2.
(a) Growth of strain TL146 and liberation of temperate bacteriophage φ146 after mutagenic agent treatment (0.1 μg of MC per ml or 60 J of UVc irradiation per m2)]. The arrow indicates the time of treatment with mutagenic agents. (b) Kinetics of temperate bacteriophage φ146 liberation after treatment of a culture of strain TL146 with MC (0.1 μg/ml) or UVc irradiation (60 J/m2). The arrow indicates the time of treatment with mutagenic agents.

