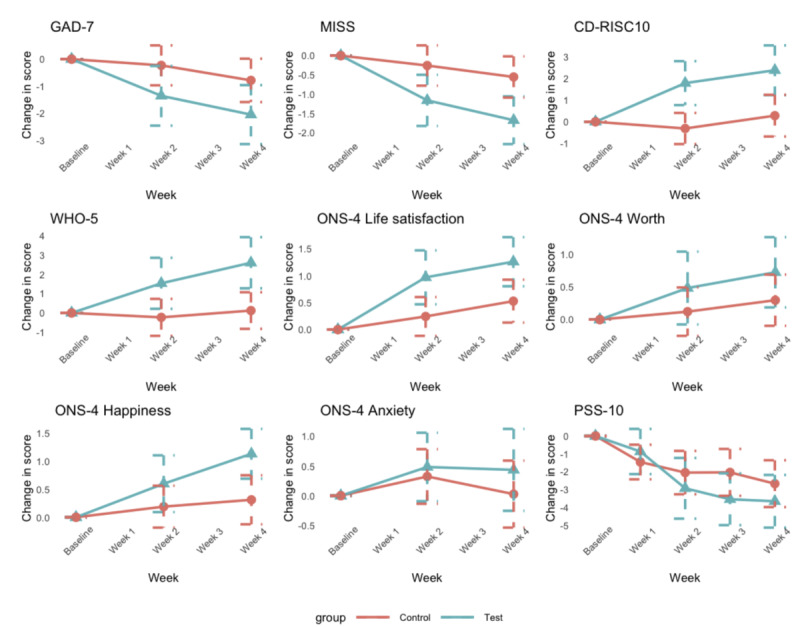
Figure 4.

Between-group analyses showing the change from baseline on outcome measures at each time point. Data points represent the mean and bars are standard errors. PSS-10: 10-item Perceived Stress Score; ONS-4: Office of National Statistics Four Subjective Well-being Questions; GAD-7: 7-item Generalized Anxiety Disorder scale; WHO-5: World Health Organization-5 Well-Being Index; CD-RISC: Connor-Davidson Resilience Scale; MISS: Minimal Insomnia Scale.
