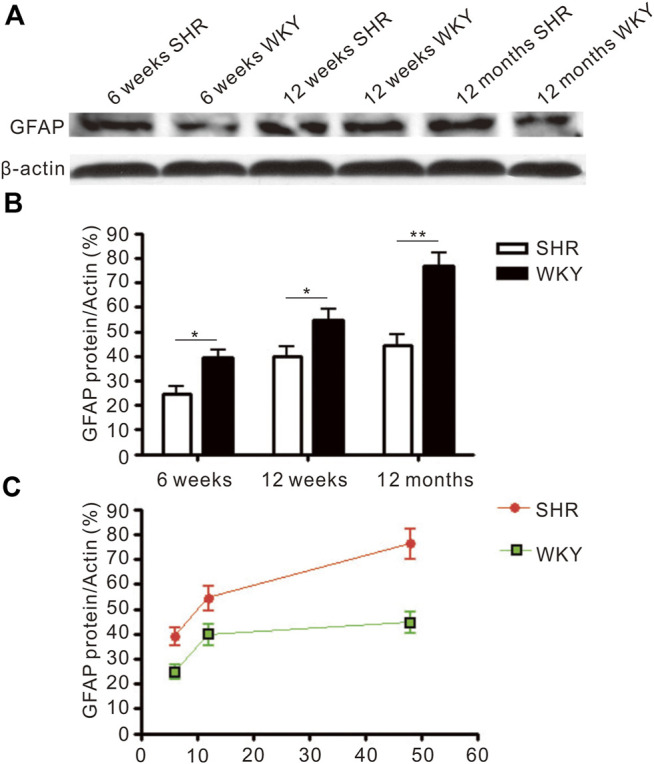
FIGURE 4.

The level of GFAP protein expressed in the frontal cortex. (A) The Western blot result of GFAP in the frontal cortex of SHR and WKY. (B) The increased expression of GFAP in the frontal cortex was more severe in the SHR than in WKY. *p < 0.05 versus age-matched WKY control, **p < 0.01 versus age-matched WKY control. (C) The change of GFAP expression in the frontal cortex in aged process of SHR and WKY. The values represent mean ± SD.
