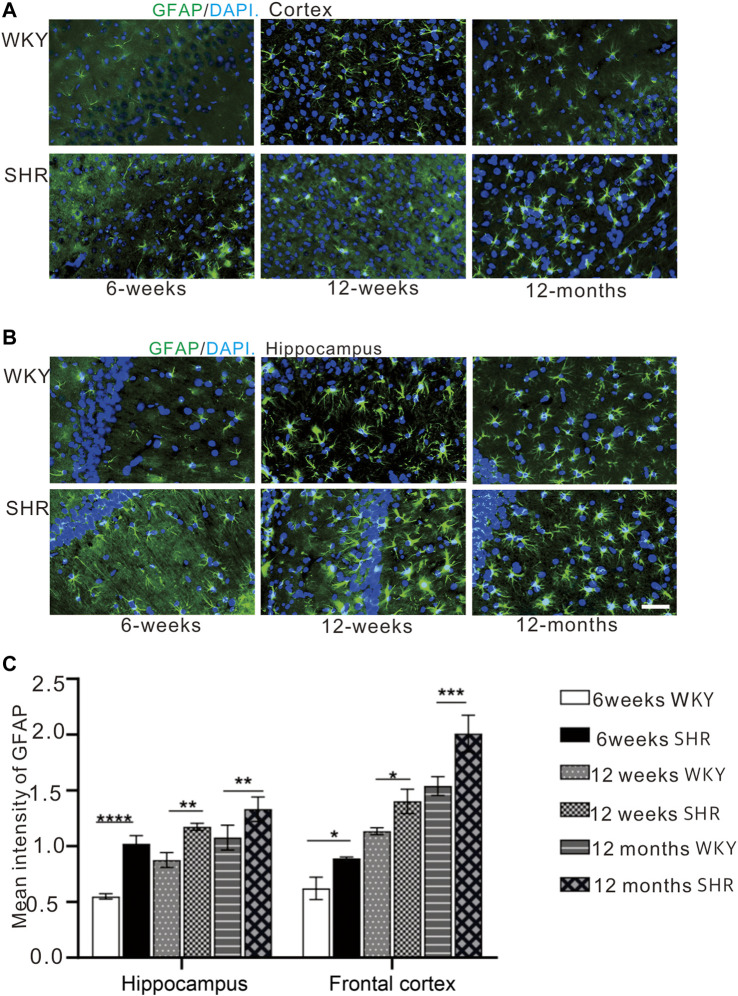
FIGURE 5.
GFAP immunofluorescence showed that the expression of GFAP in the cortex and hippocampus of SHR rats was increased compared with that of WKY rats. (A) the expression of GFAP in prefrontal cortex of WKY and SHR, (B) the expression of GFAP in hippocampal CA1 of WKY and SHR, bar = 20 μm *p < 0.05 versus age-matched WKY control. **p < 0.01, age-matched WKY control. ***p < 0.001 age-matched WKY control. The values represent mean ± SD. (C) The mean intensity of GFAP was upregulated in the SHR at each age-matched group in the hippocampus and frontal cortex.

