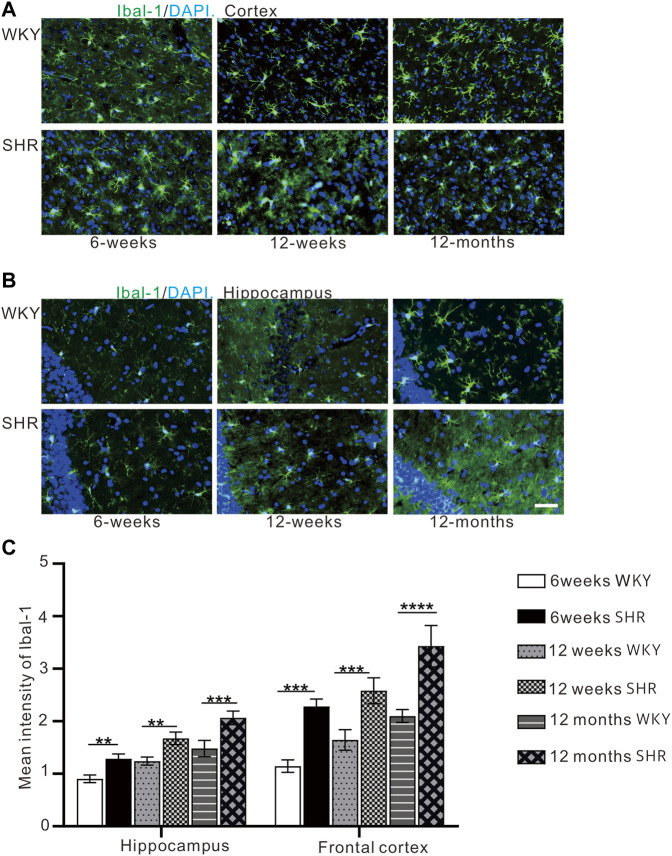
FIGURE 6.
(A) The expression of iba-1 in the prefrontal cortex of WKY and SHR. (B) the expression of iba-1 in the hippocampal CA1 region of WKY and SHR. (C) Iba-1 immunofluorescence showed that the expression of iba-1 protein in the cortex and hippocampus of SHR was increased compared with that of WKY Group, bar = 100 μm. **p < 0.01 versus age-matched WKY control. ***p < 0.001, vs. age-matched WKY control. The values represent mean ± SD.

