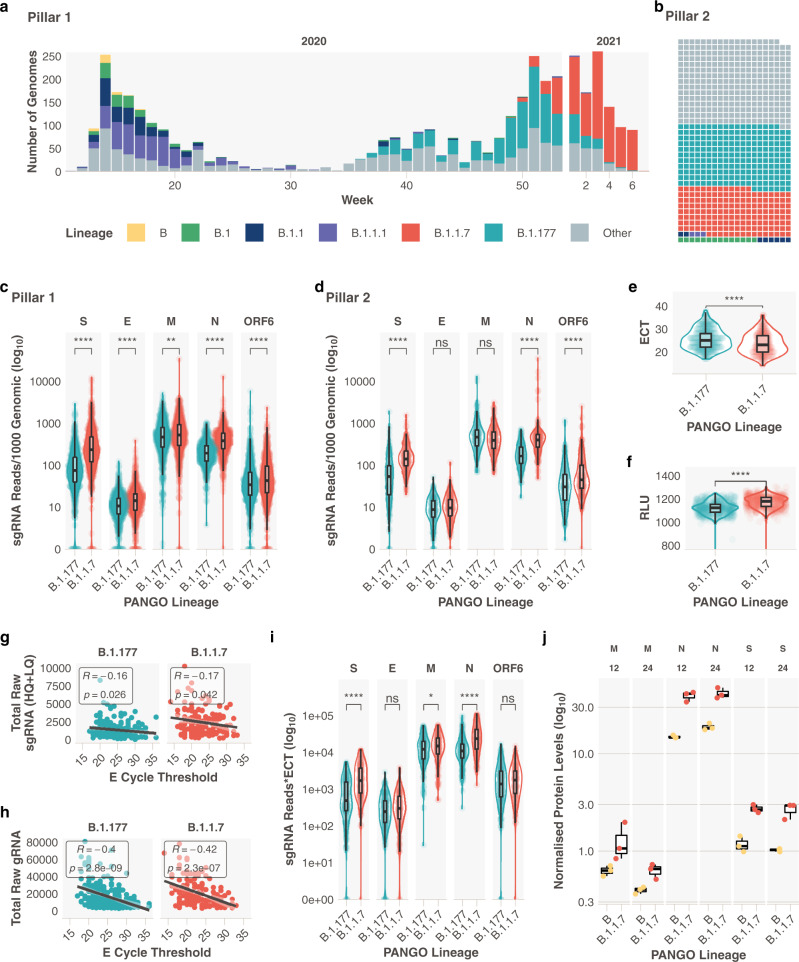
Fig. 1. Subgenomic RNA abundance is increased in B.1.1.7 infections.
a Pillar 1 SARS-CoV-2 lineages over time (B.1.1.7n = 729, B.1.177n = 764). The number of genomes is representative of the number of positive cases in pillar 1 at that time, which reflects the epidemic curves of the SARS-CoV-2 pandemic in the UK. b Representation of lineage composition of pillar 2 data (B.1.1.7n = 150, B.1.177n = 179). c sgRNA abundance in samples of lineages B.1.177 and B.1.1.7 in pillar 1 samples from the most highly expressed ORFs. d sgRNA abundance in samples of lineages B.1.177 and B.1.1.7 in pillar 2 samples from the most highly expressed ORFs. e E gene cycle threshold (ECT) for B.1.177 (n = 257) and B.1.1.7 (n = 185) lineages. f Relative light units (RLU) for B.1.177 (n = 626) and B.1.1.7 (n = 626) lineages. g E gene cycle threshold compared to total raw sgRNA counts (high and low quality) for B.1.177 and B.1.1.7. Correlation coefficient and p value using Pearson. h E gene cycle threshold compared to total raw genomic RNA counts for B.1.177 and B.1.1.7. Correlation coefficient and p value using Pearson. i Raw sgRNA counts normalised to E gene cycle threshold (sgRNA*ECT). j Protein abundance for S M and N proteins measured by LC-MS/MS and normalised to ORF1a in B and B.1.1.7 infected TMPRSS2 & ACE2 expressing A549 cells at 12 and 24 h post infection (n = 3 independent experiments). All p values (except g, h, j) calculated using an unpaired Wilcoxon signed-rank test and adjusted for multiple testing with the Holm method (**** <0.0001, *** <0.001, ** <0.01, * <0.05). All boxplots depict the 25th, 50th (median), and 75th percentiles, and whiskers represent the most extreme datapoint which is no more than 1.5x the interquartile range. B.1.1.7 is represented in red, B.1.177 in teal, B in yellow, B.1 in green, B.1.1 in navy blue, B.1.1.1 in purple and other lineages in grey.

