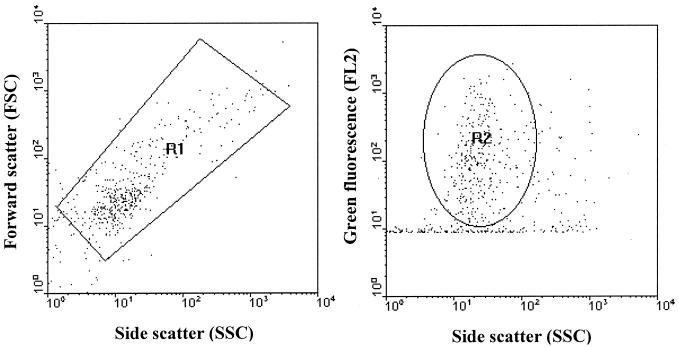
FIG. 3.
Flow cytometric analysis of E. coli MC4100/pTGFP2 cells (induced with 50 ng of oxytetracycline per ml) within soil. Region 1 defines where bacteria lie according to size (left). The second dot plot (right) is gated on bacteria (region 1 [R1]). Region 2 (R2) defines the population of GFP-expressing bacteria.

