
FIGURE 4. Three-Dimensional Left Atrial Simulation Showing Sustained Rotor Activity Until the End of Simulation (10 s) in a Patient With Arrhythmia Recurrence Post-Ablation.
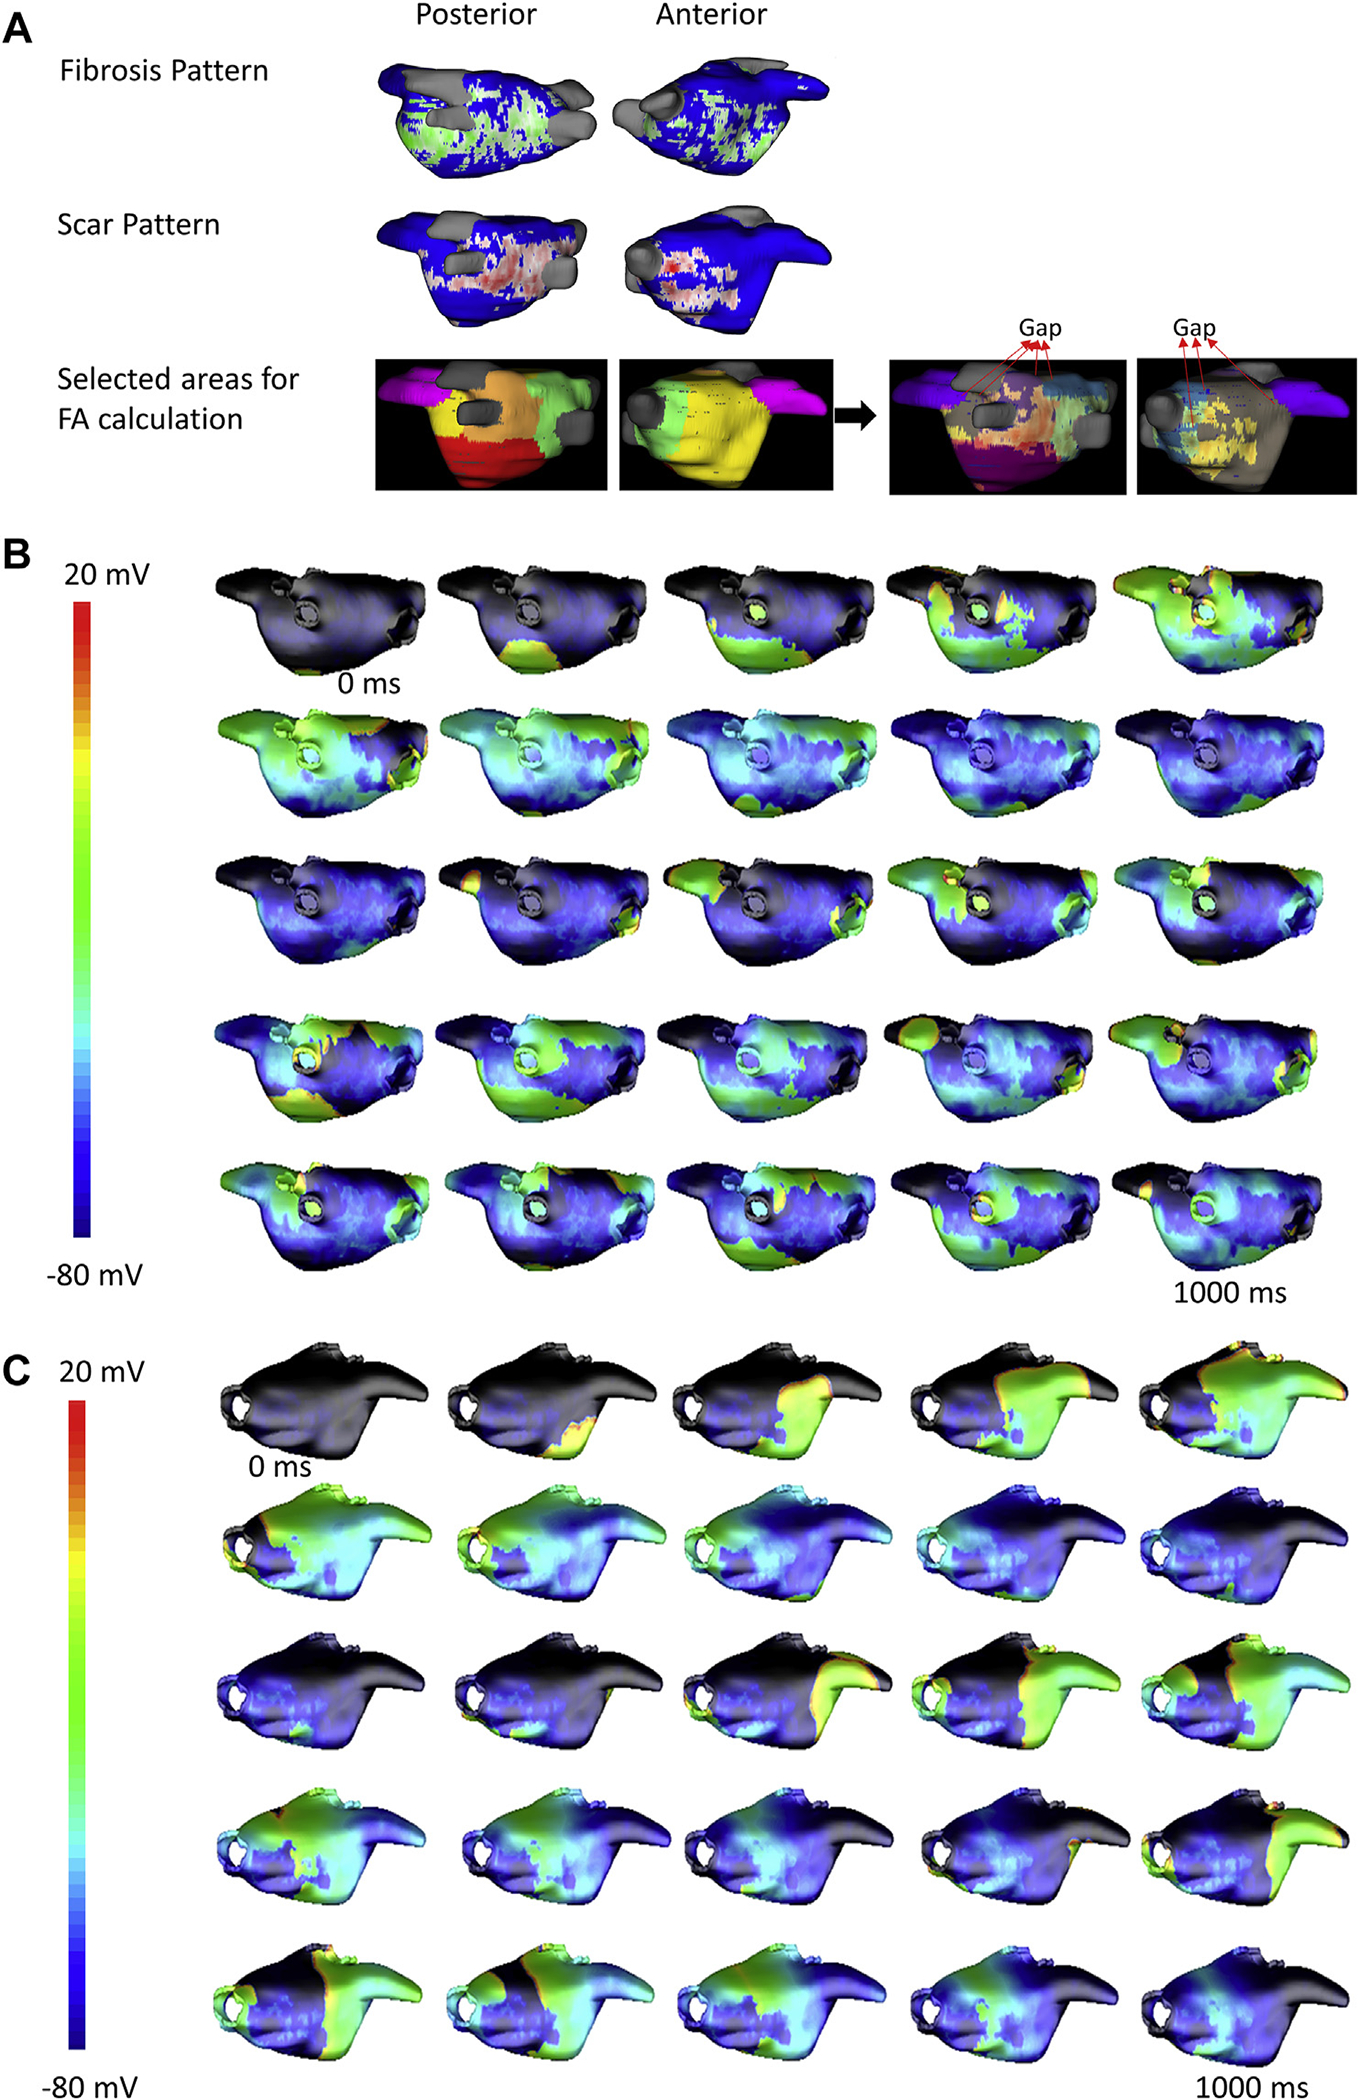
(A) Fibrosis (green, top row) and scar (red, middle row) in the left atrium based on pre- and post-ablation cardiac magnetic resonance, respectively, along with the different regions used for fibrillatory area (FA) calculation (bottom row) are shown. Gaps in the scar through which activation spreads to adjacent regions is marked on the right panels. Snapshots of the transmembrane potential in the left atrial wall at different time points are shown in (B) posterior view and (C) anterior view.