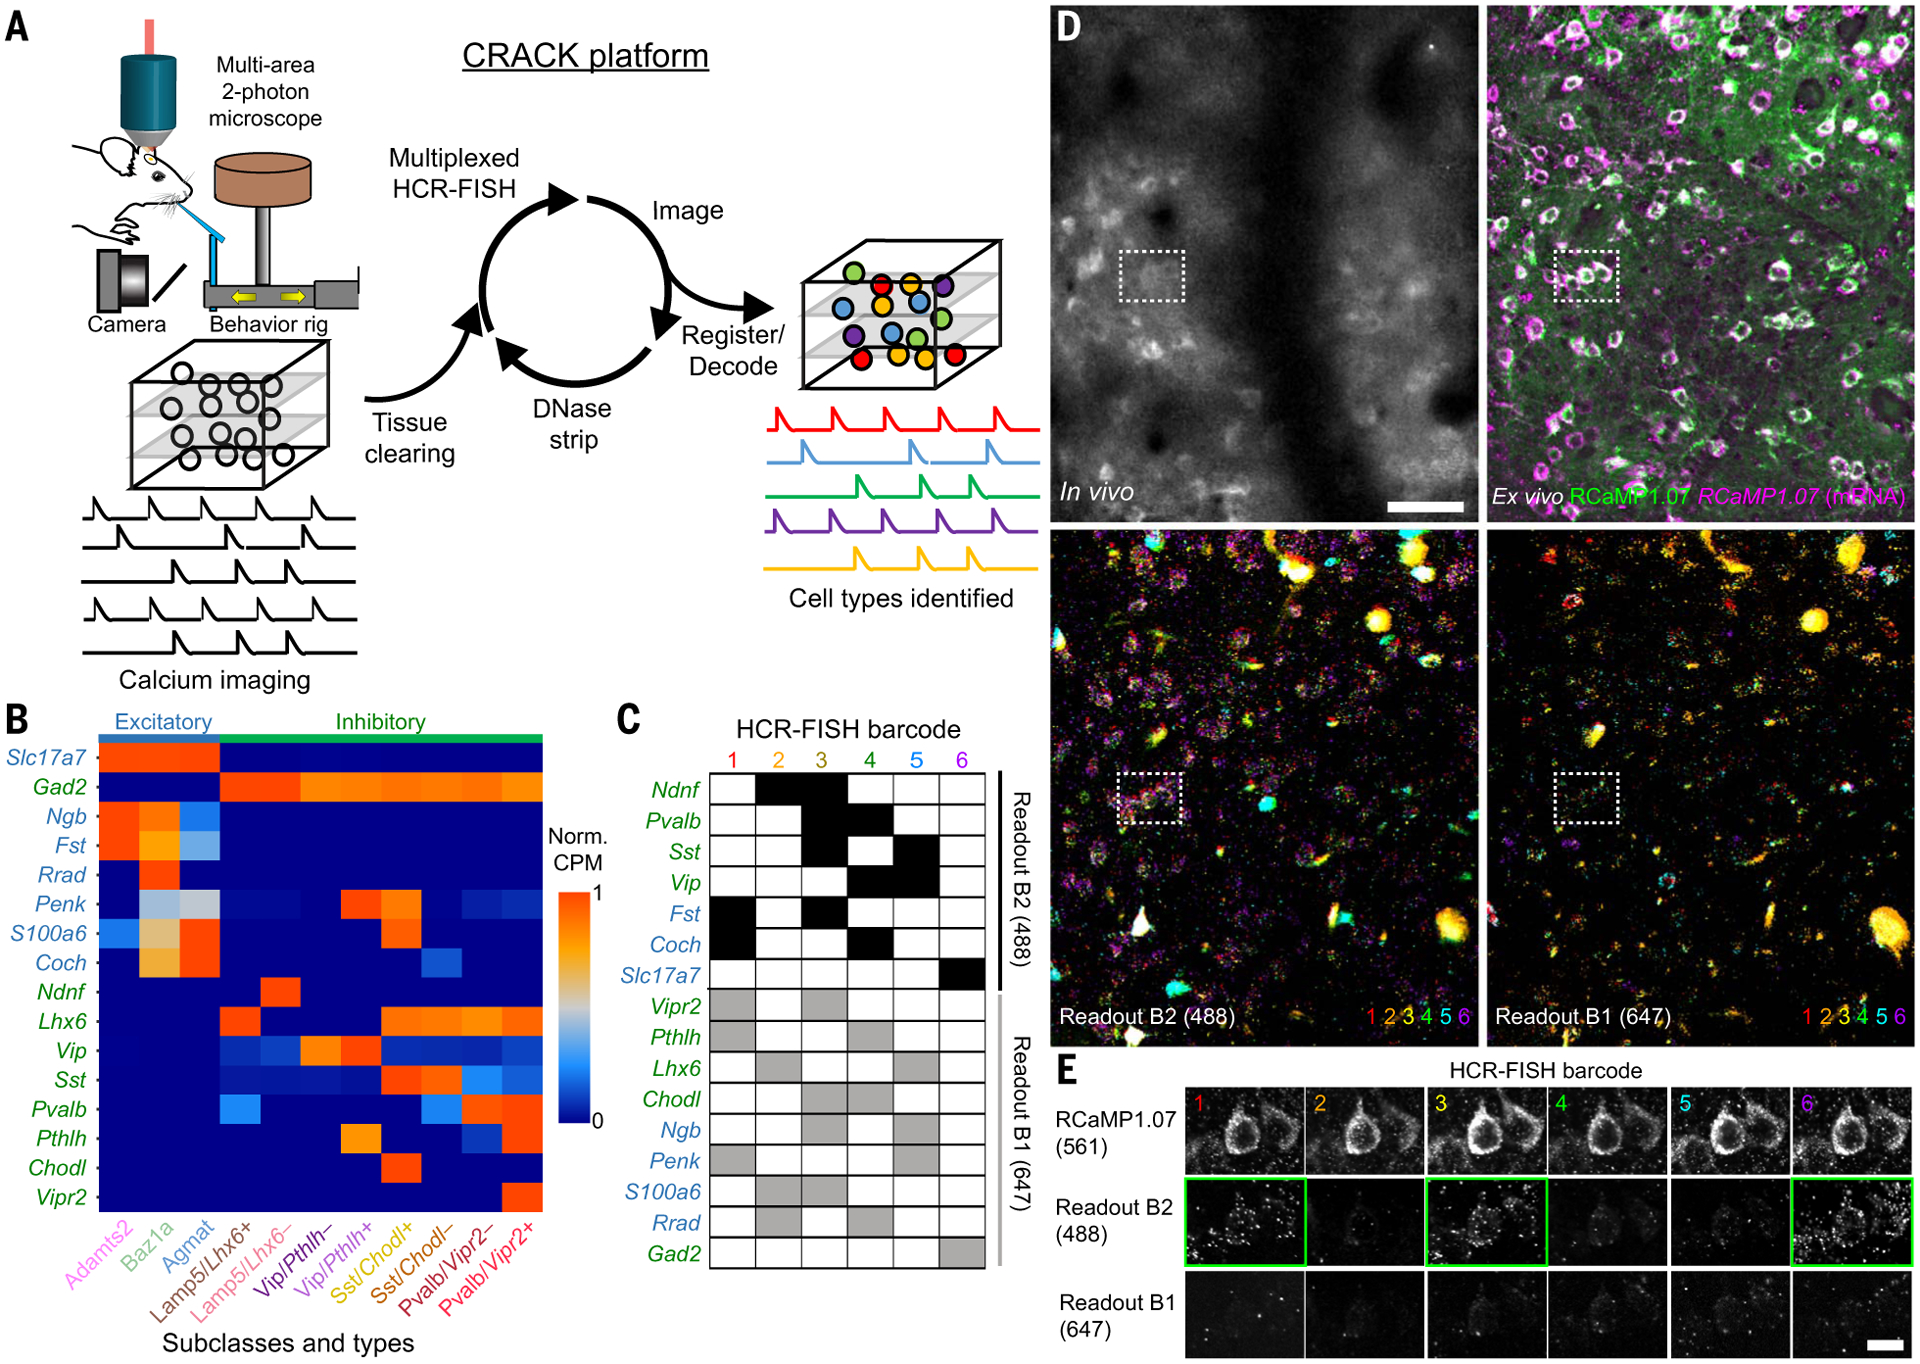
Fig. 1. Multiplexed identification of transcriptomic cell subclasses and types in functionally imaged neurons.

(A) Schematic of the CRACK platform. (B) Expression patterns of genes selected to identify L2/3 S1 excitatory (blue) and inhibitory (green) cell subclasses and types. (C) Barcode scheme for multiplexed HCR-FISH of selected genes. (D) Registration of in vivo calcium-imaged neurons to ex vivo tissue section across multiple rounds of HCR-FISH. (Top left) In vivo two-photon images of RCaMP1.07+ neurons. (Top right) Ex vivo confocal images of reidentified RCaMP1.07+ neurons showing endogeneous protein (green) followed by HCR-FISH staining transcripts (magenta). (Bottom) Overlays of (left) B2-488 and (right) B1-647 readout channels across all HCR-FISH barcode rounds. (E) Decoding of in vivo imaged neuron [(D), dotted rectangle] identified as an Adamts2 cell type expressing Fst and Slc17a7. Positive readouts are identified with green rectangles. Scale bars, (D) 50 μm; (E) 20 μm.
