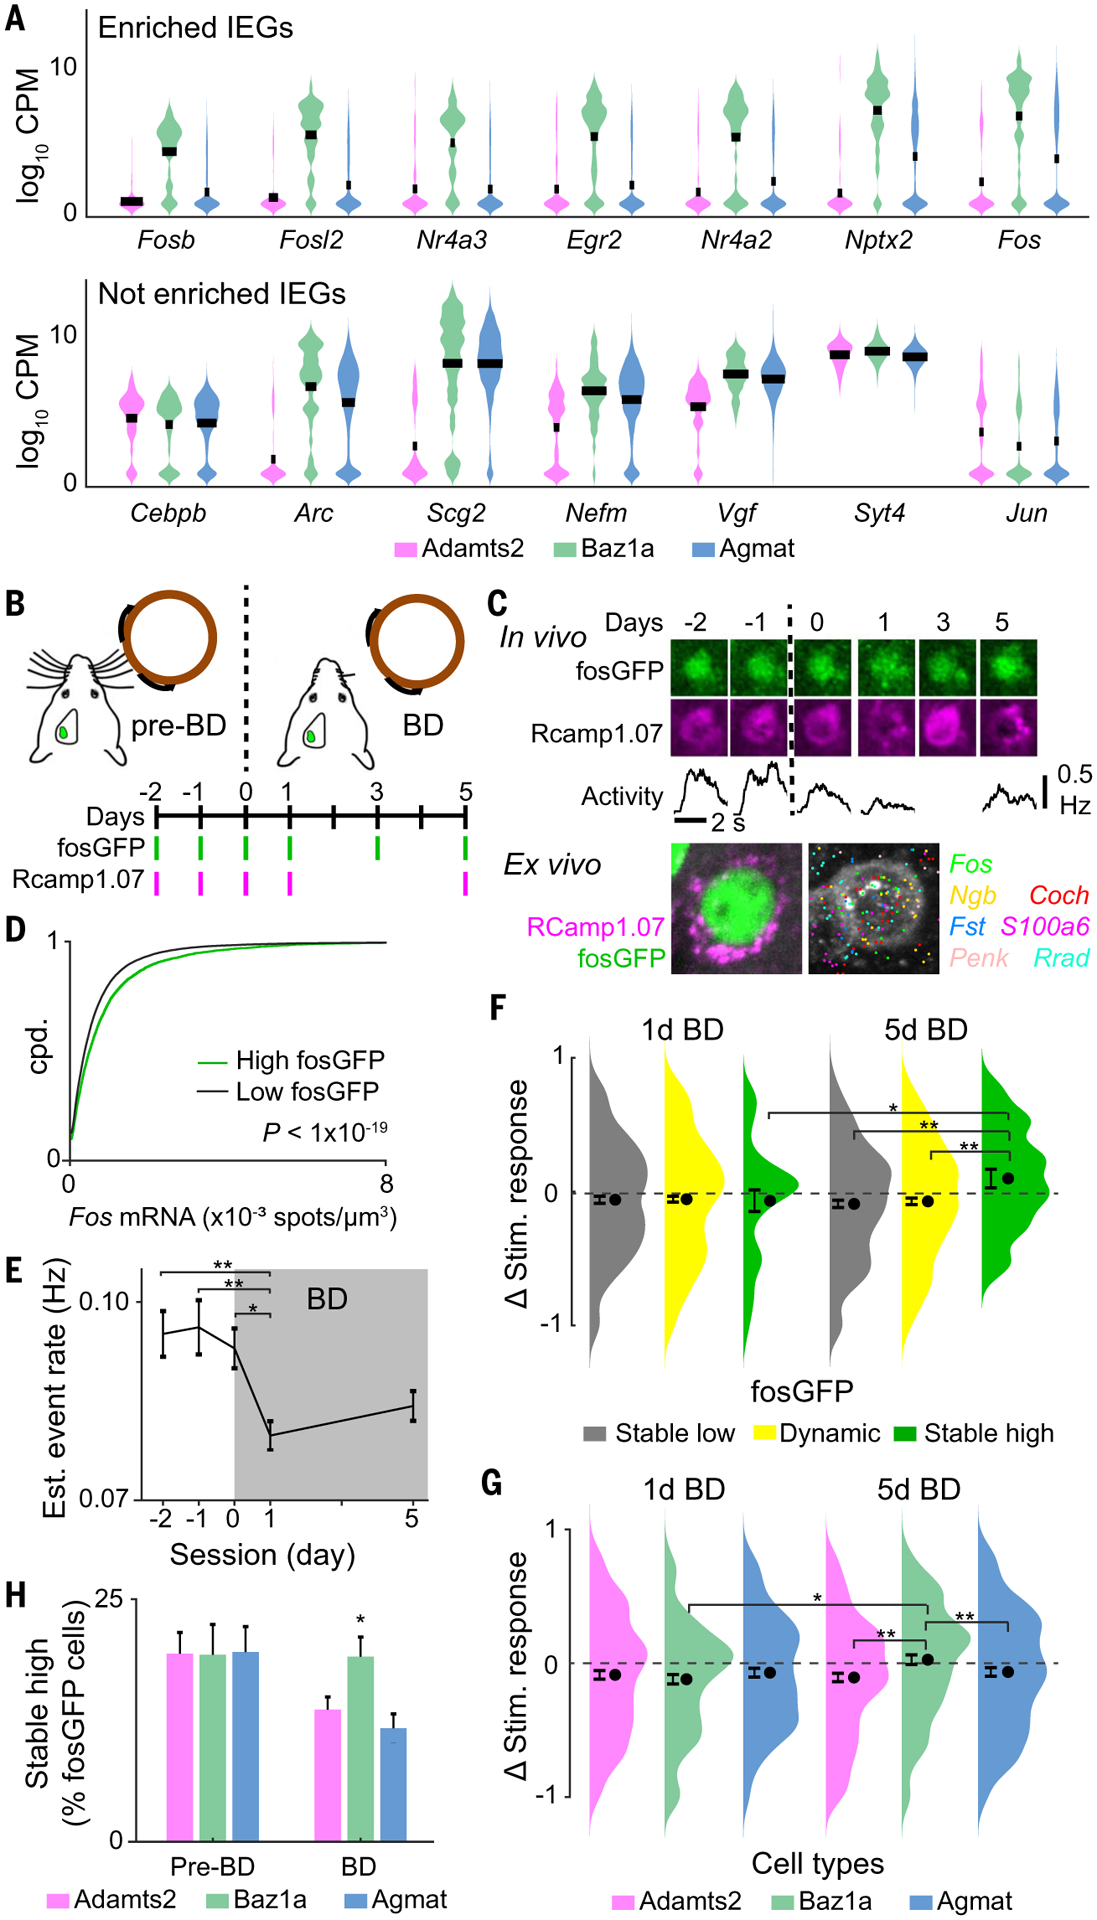
Fig. 3. Persistent IEG expression and homeostatic plasticity in Baz1a neurons.

(A) Examples of selectively (top) enriched and (bottom) not enriched immediate early genes in Baz1a cells. (B) Time course of bilateral whisker deprivation (BD) experiment. (C) (Top) Example of Baz1a neuron with stable high fosGFP expression across in vivo imaging sessions. (Middle) Average stimulus responses during calcium imaging. (Bottom) Post hoc identification of neuron and HCR-FISH for select genes. (D) HCR-FISH Fos spot density in high (1.2-fold above background) and low fluorescent fosGFP cells (two-tailed Student’s t test). (E) Mean stimulus-evoked activity before and after BD across functionally imaged neurons (one-way ANOVA with post hoc multiple comparison test, n = 2569 cells from three animals). (F) Change in stimulus-evoked responses before BD versus at 1 day or 5 days BD across neurons with stable low, dynamic, and stable high fosGFP expression (two-tailed Student’s t test, n = 790 cells from three animals). (G) Change in stimulus-evoked responses before BD versus at 1 day or 5 days BD across excitatory cell types (χ2 test, n = 181 Adamts2, 136 Baz1a, and 153 Agmat cells from three animals). (H) Fraction of fosGFP neurons with stable high expression across all pre-BD sessions (days −2, −1, and 0) and across all BD sessions (days 1, 3, and 5) for excitatory cell types (two-tailed Student’s t test, n = 3753 cells from three animals). * P < 0.05, ** P < 0.005 in (E) to (G). Error bars = SEM; (H) SD from bootstrap analysis.
