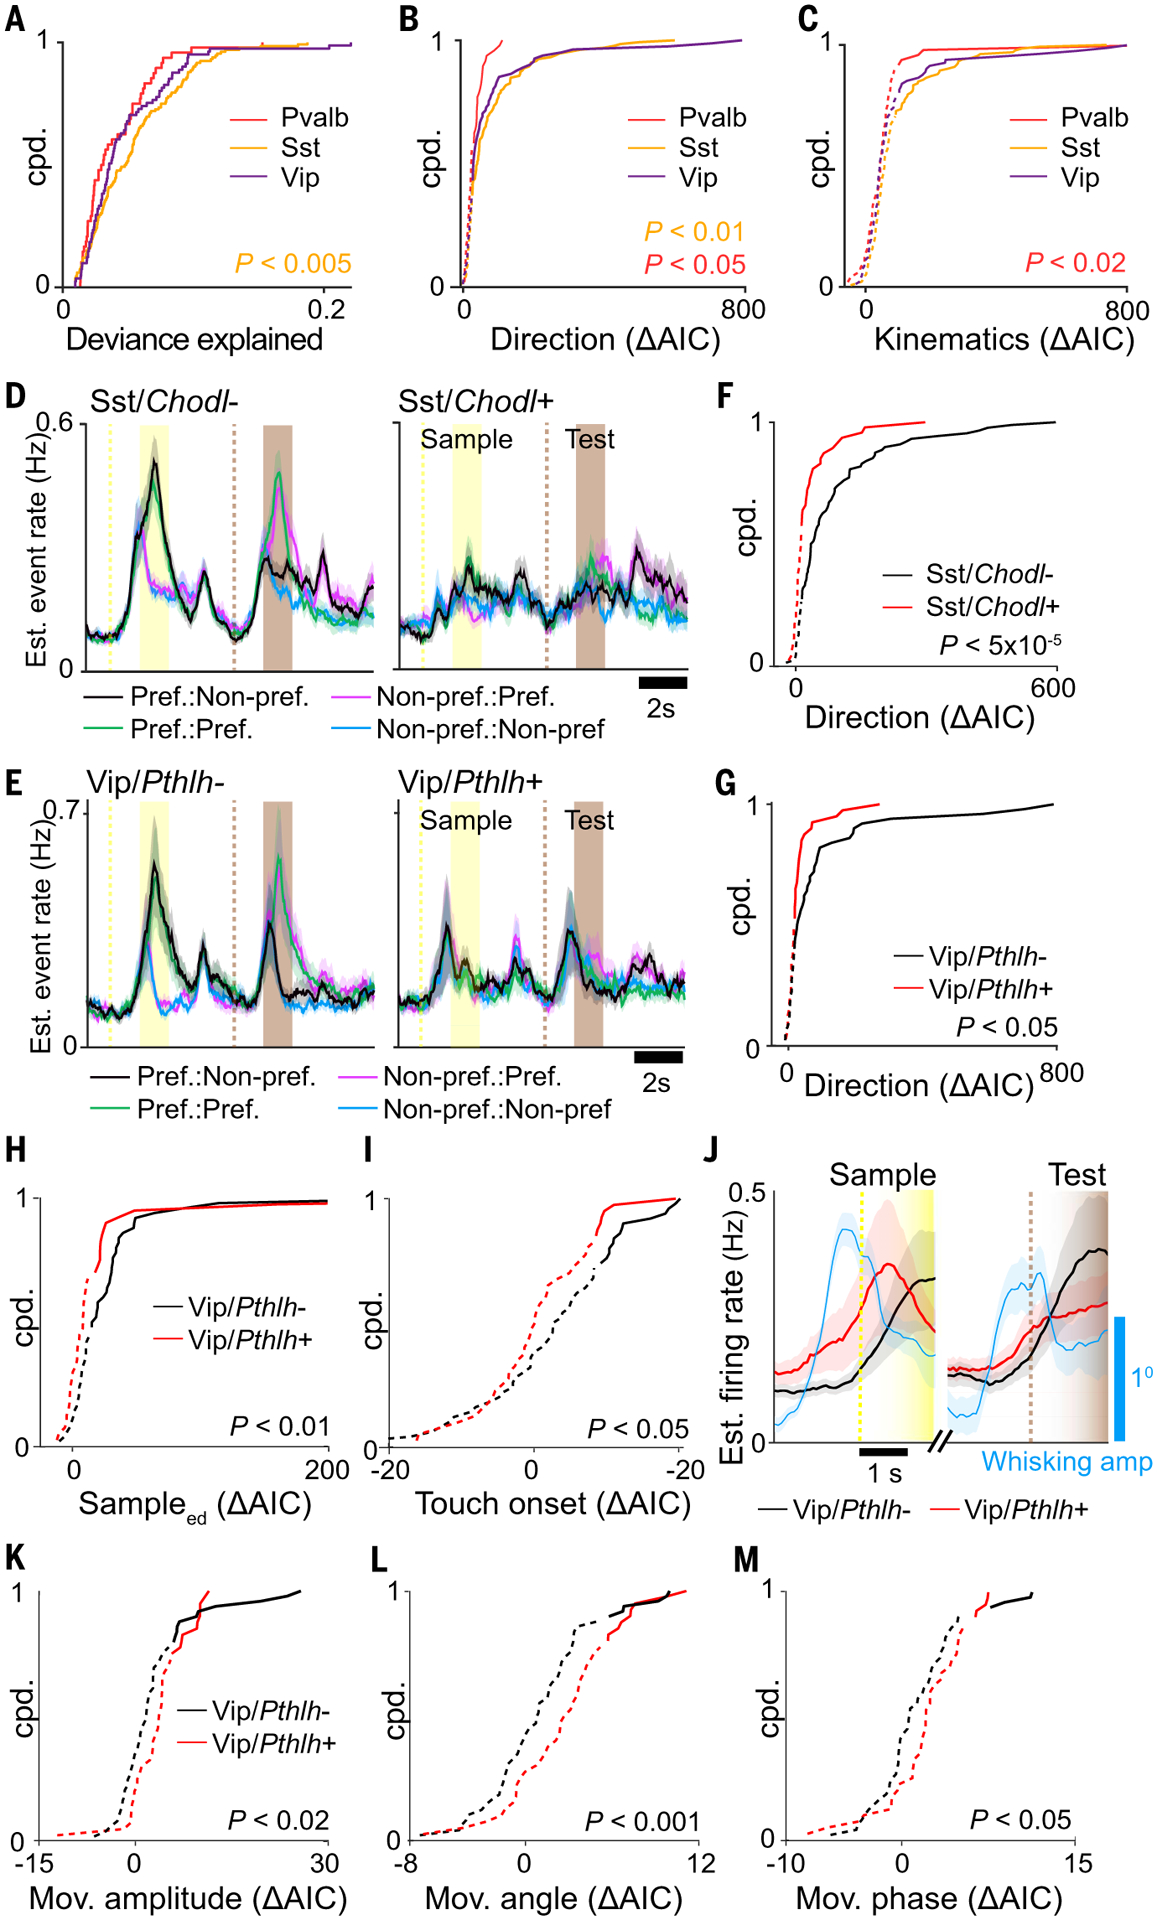
Fig. 4. Task encoding across L2/3 inhibitory subclasses.

(A to C) Cumulative probability distributions for (A) full model deviance explained, (B) encoding strength of stimulus direction, and (C) encoding strength of whisker kinematics for three major inhibitory subclasses (Mann Whitney U Test). (D and E) Estimated event rate responses to preferred stimulus direction for (D) Sst subclasses and (E) Vip subclasses. (F and G) Cumulative probability distribution of ΔAIC for task factor encoding direction for (F) Sst subclasses and (G) Vip subclasses (Mann Whitney U Test). (H and I) Cumulative probability distribution of ΔAIC for (H) task factors encoding sampleEARLY DELAY and (I) touch onset for Vip subclasses (Mann Whitney U Test). (J) Estimated event rate for Vip subclasses along with mean whisking amplitude aligned to whisker-rotor touch onset preceding sample and test periods. (K to M) Cumulative probability distribution of ΔAIC for task factors encoding (K) free whisking amplitude, (L) angle, and (M) phase for Vip subclasses (Mann Whitney U Test). In (B), (C), (F) to (I), and (K) to (M), solid and dotted lines indicate significant (P < 0.01) and nonsignificant encoding strengths, respectively, by means of χ2 test. Shaded regions in (D) and (E) indicate SEM. n = 48 Pvalb cells, 47 Sst/Chodl+ cells, 88 Sst/Chodl− cells, 40 Vip/Pthlh+ cells, and 49 Vip/Pthlh− cells from seven animals.
