
Fig. 5. Cell type functional connectivity across task networks.
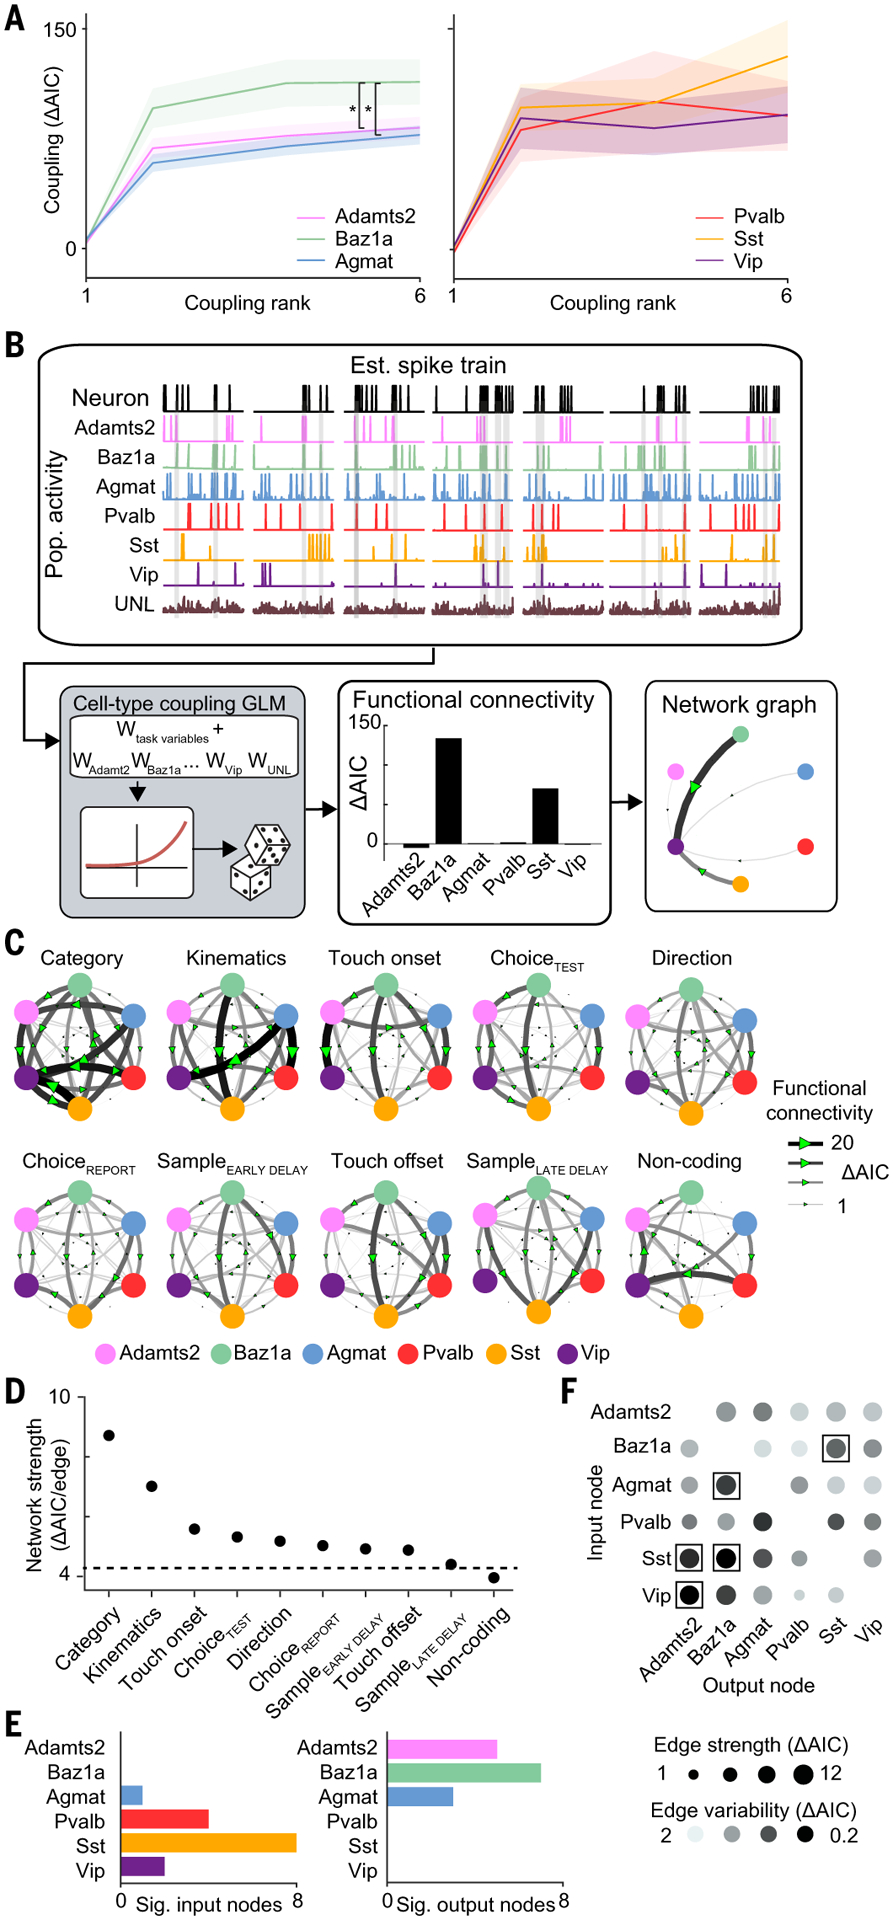
(A) Strength of coupling factor encoding across varying coupling ranks. *P < 0.02, repeated measures ANOVA test, F2,6. (B) Schematic of network analysis for example neuron. (C) Task-specific networks generated by selecting for neurons with significant encoding for a given task factor in the task GLM. Networks are sorted according to average edge strength. (D) Network strength across task networks. The dotted line indicates strength of shuffled network. (E) Cell type and subclass differences in number of significant (left) input and (right) output nodes across task networks. (F) Strength and variability of functional connectivity in network edges across task networks. Network edges with significantly high strength and low variability are indicated with a box. P < 0.05, permutation test. Shaded region in (A) indicates SEM. n = 1996 neurons, direction; 1374 neurons, sampleEARLY DELAY; 1076 neurons sampleLATE DELAY; 360 neurons, category; 623 neurons, choiceTEST; 830 neurons, choiceREPORT; 898 neurons, touch onset; 1033 neurons, touch offset; 864 neurons, kinematics; and 273 neurons, noncoding from seven animals.