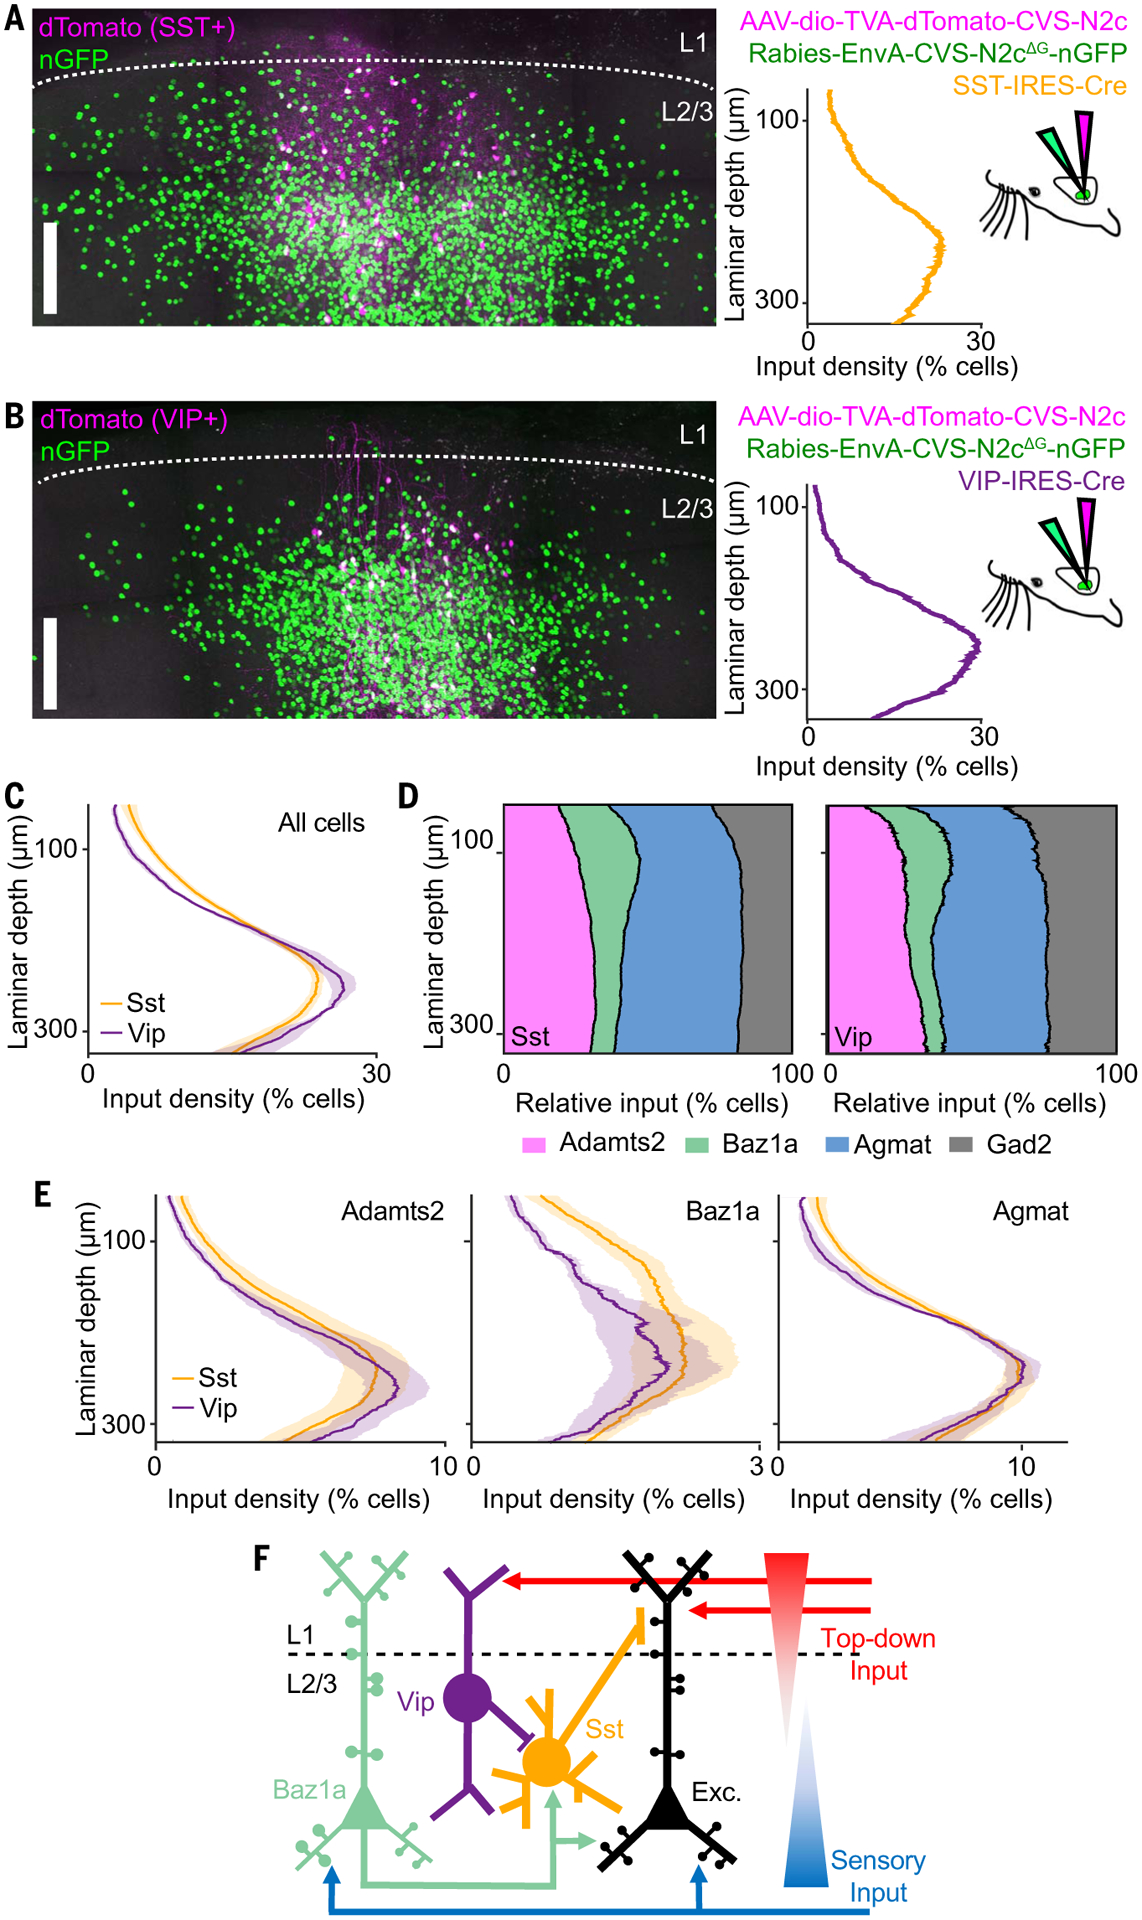
Fig. 6. Upper layer Ba1za neurons target Sst neurons.

(A and B) Example of cell type–specific transmonosynaptic tracing in (A) Sst-IRES-Cre and (B) Vip-IRES-Cre mice. (Left) Confocal images of starter cells (magenta) and nGFP+ input neurons (green). (Right) Sublaminar distribution of input density from left images, along with injection scheme. (C) Average sublaminar somatic density distribution of inputs across L2/3 for Sst and VIP neurons. (D) Relative proportion of excitatory cell types and Gad2+ inhibitory neurons as a function of laminar depth for Sst and Vip input neurons. (E) Density of excitatory cell types as a function of laminar depth for Sst and Vip input neurons. (F) Circuit model of L2/3 illustrating cell type–specific connectivity between Vip, Sst, Baz1a, and other local excitatory neurons. Shaded regions in (C) and (E) indicate SEM. n = 4 Sst-IRES-Cre animals, 16 slices, 33,957 neurons; and 4 Vip-IRES-Cre animals, 14 slices, 35,926 neurons. Scale bars, 100 μm.
