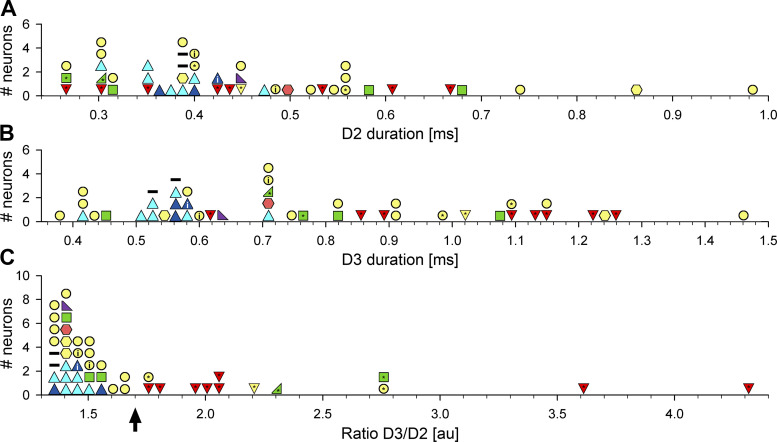
Figure 3.
Histograms of AP durations D2 (A), D3 (B), and the ratio D3/D2. The meaning of symbols is the same as in Fig. 2. The arrow in C indicates the ratio 1.7 that separates neurons with the “short” and “long” action potentials. AP, action potential.

