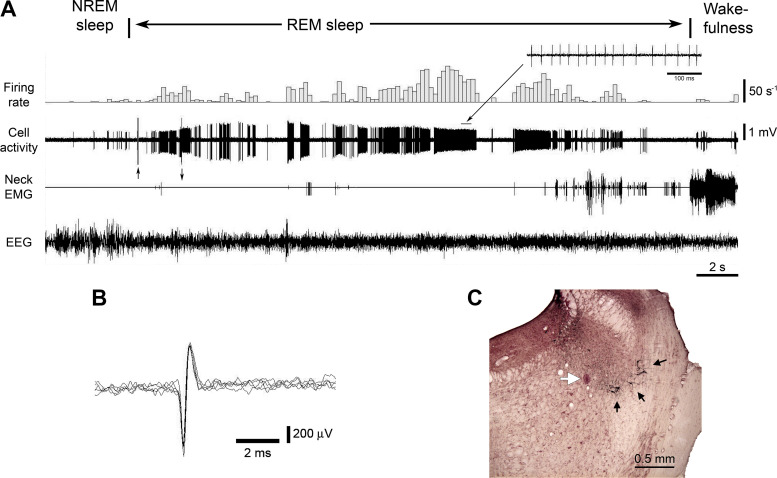
Figure 7.
Example of the activity of a REM-ON neuron during sleep and wakefulness. A: the neuron had an irregular discharge that dramatically increased during REM sleep (average firing rate 19.7 s−1, CV 4.44) as compared with NREM sleep (average firing rate 0.942 s−1, CV 1.63) and wakefulness (average firing rate 2.33 s−1, CV 2.92) (see also inset showing cell discharge at near maximal frequency). Note the changes in the amplitude of action potentials, which were likely due to brain micro-movements relative to the tip of recording electrode that occurred during transition between the behavioral states. The arrows pointed up and down at the beginning of the record indicate artifacts that caused by switching on and off the “DC recording” mode. B: superimposed five traces show short duration biphasic action potentials that were characteristic for the REM-ON neurons. C: a coronal pontine section stained for TH and neutral red shows the recording site of this neuron (white arrow). Note the distant location of TH-positive A7 neurons (black arrows) from the recording site, suggesting that the recorded neuron was not noradrenergic. CV, coefficient of variability; NREM, non-rapid-eye-movement; REM, rapid-eye-movement; TH, tyrosine hydroxylase.

