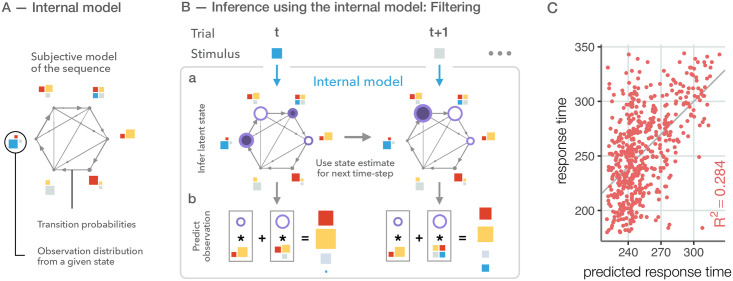
Fig 2. Inference and predictions using the internal model.
A We formulate the internal model as an iHMM, where the number of latent states (grey circles), transitions between the states (arrows), and the distribution of possible stimuli for any given state (coloured squares) needs to be inferred by the experimenter. Width of arrows is proportional to transition probability and arrows are pruned if the transition probability is below a threshold; size of dots indicates the probability of self-transition. Size of stimuli is proportional to appearance probability in the given state. The result of inference is a distribution over possible model structures, the figure represents a single sample from such a distribution. B Evolving the internal model from trial t to trial t + 1. At time t, participants use the internal model components to update their beliefs over the current state of the latent states (Ba, size of dark purple discs represent the posterior belief of the latent state based on the current observation, blue square). Then, participants play the model forward into the future (open purple circles). Finally, they generate predictions for the upcoming stimulus (Bb, squares in grey boxes) by summing over the possible future states (open purple circles in grey boxes). Participants use previous state beliefs and the new stimulus to update latent state beliefs. In this particular example, at trial t + 1 only one of the possible states can generate the observation, hence there is only one dark purple disk. Again, they play the dynamics forward and predict the next stimulus. C Predicted response times against actual response times are shown for individual trials for an example participant (dots). After training our inference algorithm on a training dataset of 10 blocks, we predict response times of another 10 blocks on the same day. Performance is measured as the trial-by-trial coefficient of determination between measured and predicted response times (R2, coloured label).

