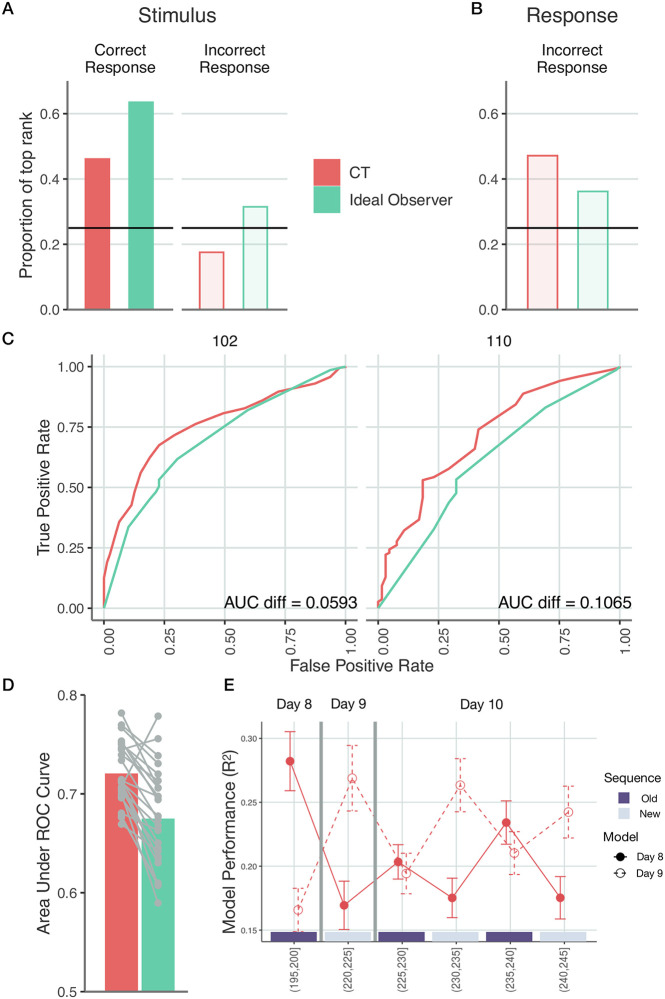
Fig 5. Validation of the inferred internal model by selectively changing the task and the stimulus statistics.
A-D Choice predictions by CT (red) and the ideal observer model (green). Models are trained on response times for correct key presses on Day 8 and tested on both correct and error trials the same day. A, Proportion of trials where the model ranked the upcoming stimulus first. For correct trials both models have preference for the stimulus. For incorrect trials, the ideal observer model falsely predicts the stimulus in more than a quarter of the time. B, Proportion of trials where the model ranked the button pressed by the participant first. For incorrect responses, both models display a preference towards the actually pressed key over alternatives. C, ROC curves for two example participants based on the subjective probabilities of upcoming stimuli (held-out dataset). Area under the ROC curve characterizes the performance of a particular model in predicting error trials. D, Area under ROC curve. Grey dots show individuals, bars show means. E, Investigating new internal models that emerge when new stimulus sequences are presented. Participant-averaged performance of predicting response times on Day 8–10 using CT-inferred models that were trained on Day 8 (filled red symbols) and Day 9 (open red symbols) on stimulus sequences governed by Day 8 or Day 9 statistics. On Day 9 a new stimulus sequence was introduced, therefore across-day prediction of response times corresponded to across sequence predictions. Training of the models was performed on 10 blocks of trials starting from the 11th block and prediction was performed on the last five blocks of trials (the index of the blocks used in testing is indicated in brackets). On Day 10, stimulus sequence was switched in 5-block segments between sequences used during Day 8 and Day 9 (purple and grey bars indicate the identity of stimulus sequence with colours matching the bars used in Day 8 and Day 9. Error bars show 2 s.e.m. over participants. Stars denote p < 0.05 difference.

