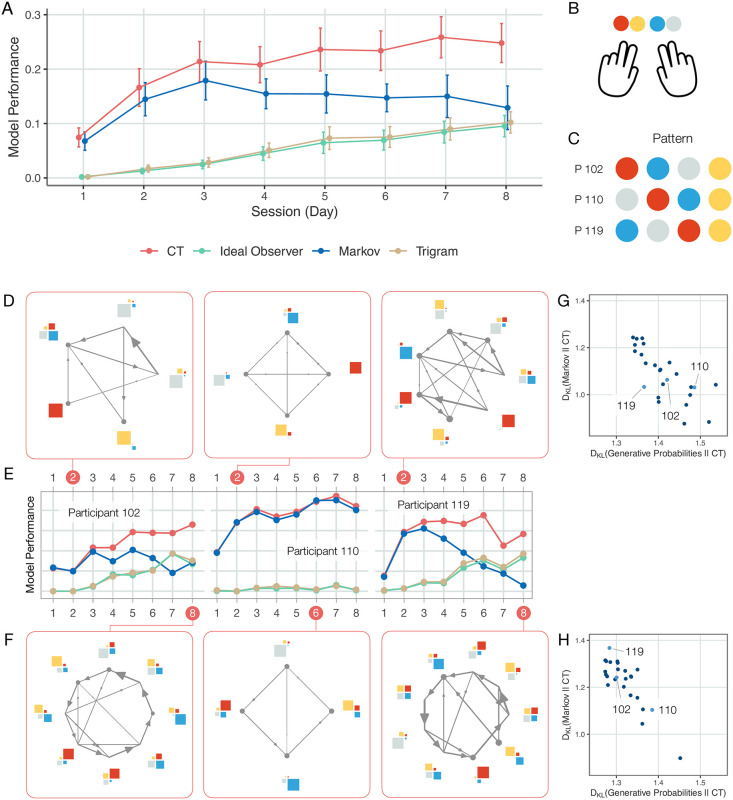
Fig 6. Evolution of the internal model with increasing training.
A Mean explained variance (dots, averaged over participants) in held-out response times in sessions recorded on successive days for the CT (red), Markov (blue), ideal observer (green) and trigram (yellow) models. Error bars denote 2 standard error of the group mean. Error bars show 2 s.e.m. B Color coding of response buttons used in this figure. C Color coding of sequence showed to participants. D-F Learning in individual participants (left, middle, and right panels corresponding to different participants: 102, 110, and 119, respectively). E Learning curves of CT, ideal observer, Markov, and trigram models. Internal models shown on D & F panels (corresponding to Days indicated by red disks on panel E, respectively) are samples from the posterior of possible internal models inferred by CT. CT predictive performance is calculated by averaging over the predictive performances of 60 samples. Participant 102 finds a partially accurate model by Day 2 (D) and a model close to the true model by Day 8 (F). Participant 110 retains a Markov model throughout the eight days of exposure. Prediction of their behaviour by the Markov model gradually improves while the predictive performance of the ideal observer model is floored, indicating that no higher-order statistical structure was learned. G & H Mismatch between subjective probabilities of upcoming stimuli derived from CT and alternative models: the ideal observer model (generative probabilities, horizontal axis); and the Markov model (vertical axis). KL-divergences of the predictive probabilities are shown for individual participants (dots) on Day 2 (G) and Day 8 (H). KL-divergence is zero at perfect match and grows with increasing mismatch.

