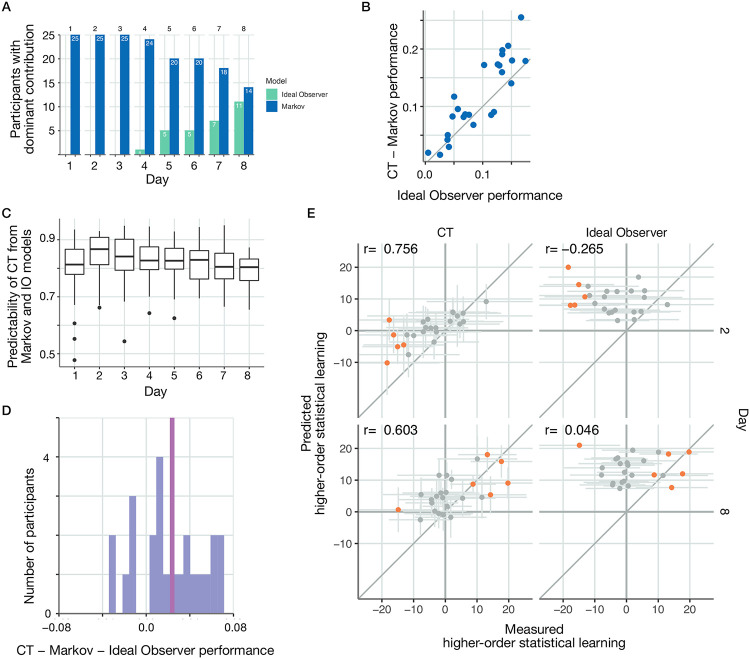
Fig 7. The internal model captured by CT can be reliably broken down into the independent contribution of an inductive bias and the ideal observer model.
A Day-by-day comparison of the number of participants for whom the predictive performance of Markov (blue) or ideal observer (green) models was higher. B Subject-by-subject comparison (dots represent individual subjects) of ideal observer model performance and normalized CT performance (the margin by which CT outperforms the Markov model) on Day 8. Dots close to the identity line (grey line) indicate cases where CT performance can be reliably accounted for by contributions from the two simpler models. Normalized CT performance closely follows the performance of the ideal observer model, and deviations tend to indicate slightly better normalized CT performance. C Performance of a linear model predicting CT model predictions on a trial-by-trial basis from a Markov and ideal observer model predictions on different days of the training. Thick mid-line indicates R2 of the trial-by-trial fit of the linear combination to CT performance averaged across participants. Boxes show 25th and 75th percentile of the distribution. Upper whiskers show largest value within 1.5 from 75th percentile. Similarly for lower whisker. Dots are data points outside the whiskers. D Histogram of the advantage of normalized CT performance over the ideal observer model. Red line marks the mean of the histogram. E Higher-order statistical learning in CT (left panels) and ideal observer model (right panels) on Day 2 (top panels) and Day 8 (bottom panels) of the experiment. Dots show individual participants. Orange dots represent participants with higher-order learning score significantly deviating from zero. CT can capture both negative deviations (Day 2) and positive deviations (Day 8) in this test and displays significant correlations across participants on both days between the predicted and measured higher-order statistical learning, indicating that subtle and nontrivial statistics of the internal model is represented in CT.

