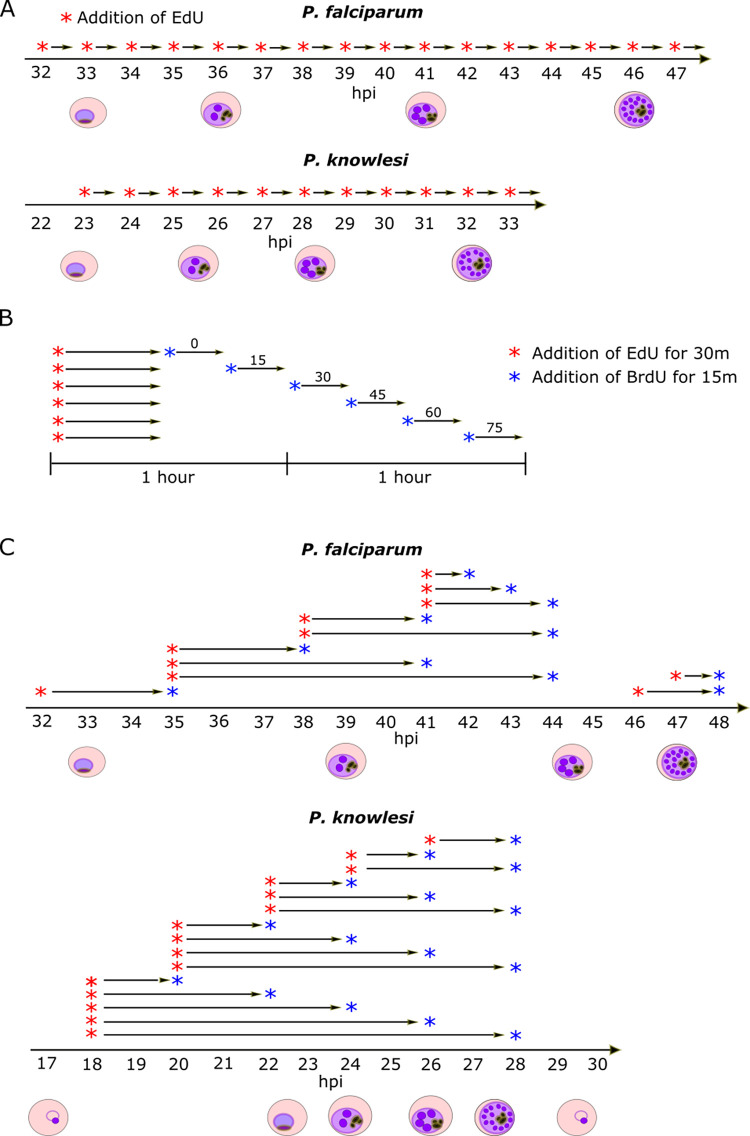
Fig 1. Schematics of experimental setup.
A: Schematics of timecourses using single EdU pulse labels. B: Schematic of experiments using sequential pulses of two nucleotides (EdU and BrdU) to determine the length of each replicative round. C: Schematics of timecourses using 2-nucleotide (EdU and BrdU) interval pulse labels.

