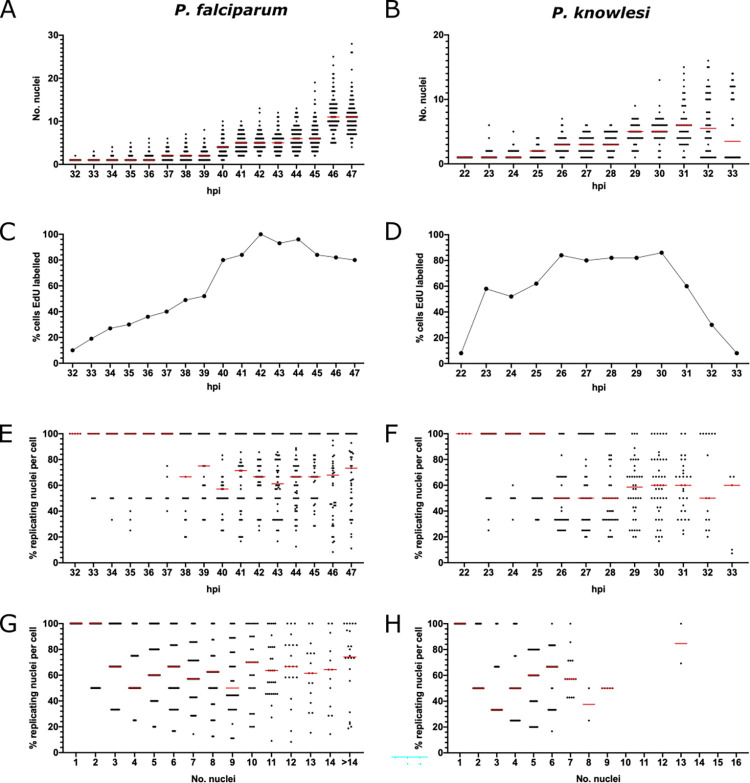
Fig 2. Length and dynamics of S-phase in P. falciparum and P. knowlesi.
A, B: Scatter graphs of nuclear numbers at each hour in P. falciparum (A) or P. knowlesi (B), n = 100 cells, medians are shown in red. Biological replicate experiments are shown in S3 Fig. C, D: Percentage of 100 cells showing some EdU labelling at each hour in P. falciparum (C) and P. knowlesi (D). E, F: Percentage of replicating nuclear masses per cell at each timepoint in P. falciparum (E) and P. knowlesi (F), n = 100, medians are shown in red. G, H: Percentage of replicating nuclear masses per cell, re-plotted by number of such masses, in P. falciparum (G) and P. knowlesi (H), n = 100, medians are shown in red.

