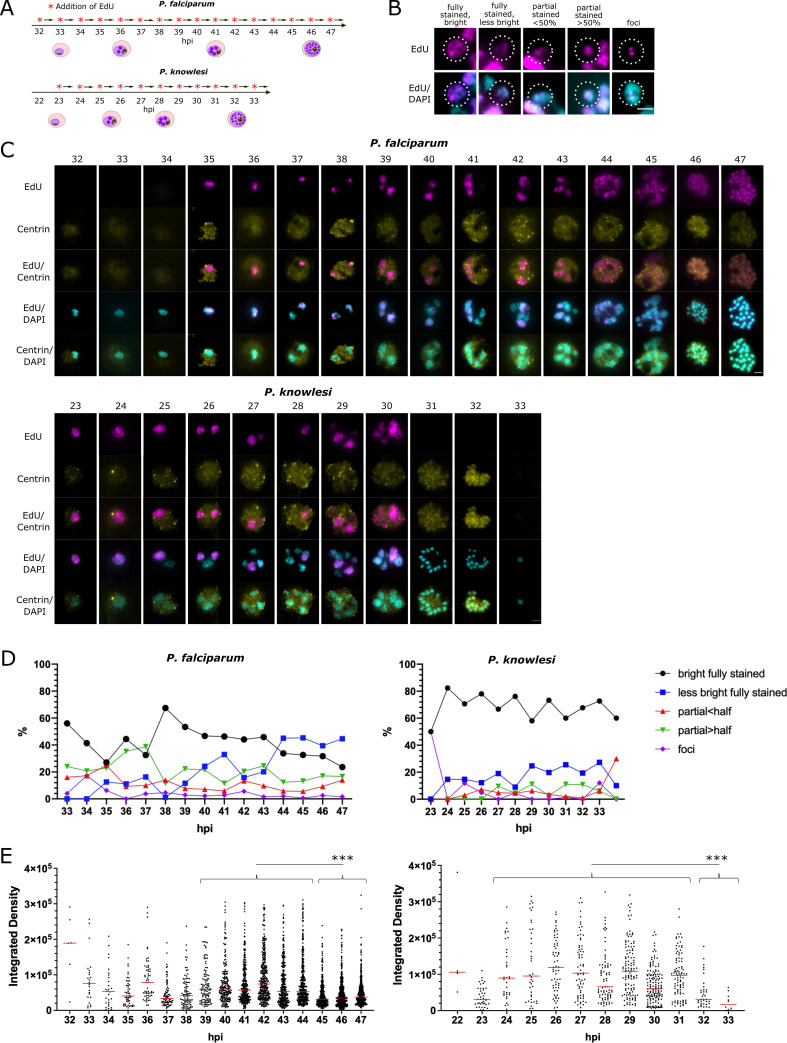
Fig 3. Patterns of DNA replication within nuclei in P. falciparum and P. knowlesi.
A: Schematic of the timecourses shown in this figure. B: Examples of 5 distinct patterns of EdU incorporation seen in replicating nuclei (P. falciparum are shown, representative of patterns in both species; dotted line highlights the relevant nuclear mass). Scale bar all panels 1μm. C: Representative examples of cells at each hour across the timecourse for P. falciparum and P. knowlesi. 46-47hpi in P. falciparum and 31-32hpi in P. knowlesi show segmented schizonts; 33hpi in P. knowlesi shows a reinvaded ring. Scale bar all panels 2μm. D: Percentages of each distinct pattern seen at each point across the timecourse in P. falciparum and P. knowlesi. E: Intensity of EdU staining (calculated as ‘integrated density’ across each nuclear mass, i.e. the sum of values for fluorescent signal in all pixels in each mass) seen at each timepoint in P. falciparum and P. knowlesi. A significant drop in EdU staining intensity is seen at the end of the timecourse in both species (***, p = 0.001, ANOVA). In P. falciparum, this correlates clearly with the rise at 44-47hpi in the pattern qualitatively categorised as ‘less bright’ in (C). Intensities in nuclear masses with each pattern of staining are shown separately in S4 Fig. Nuclei that had entirely finished replicating and showed no detectable signal were excluded.

