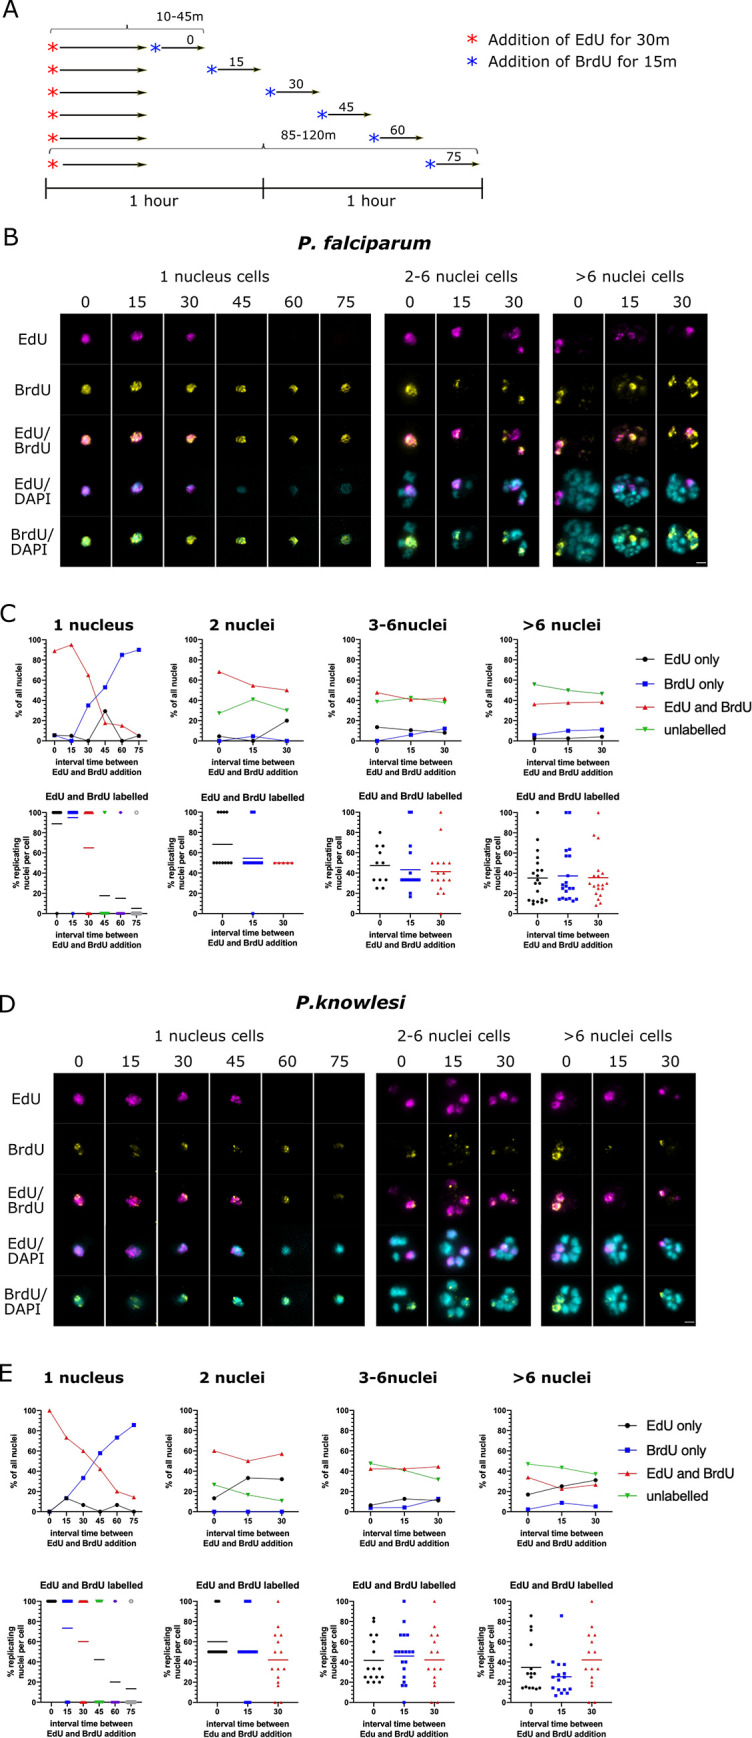
Fig 4. Replicative rounds become faster across the course of schizogony.

A: Schematic of the timecourses shown in this figure. (Biological replicate experiments are shown in S7 Fig). B: Representative examples of P. falciparum cells labelled with EdU for 30 minutes and then a 15-minute pulse of BrdU at increasing intervals. Scale bar all panels 2μm. C: Graphs showing the percentage of all nuclear masses that labelled with EdU and BrdU, firstly in mono-nuclear cells and then for 2-n, 3-6n and >6-n cells (n = 20). Scatter plots display the same data broken down per-cell, with means shown for each dataset. D: Representative examples of P. knowlesi cells labelled with EdU for 30 minutes and then a 15-minute pulse of BrdU at increasing intervals. Scale bar all panels 2μm. E: Graphs as in (C) showing the percentage of nuclear masses labelled with EdU and BrdU in P. knowlesi cells of increasing ploidy (n = 20 per category).
