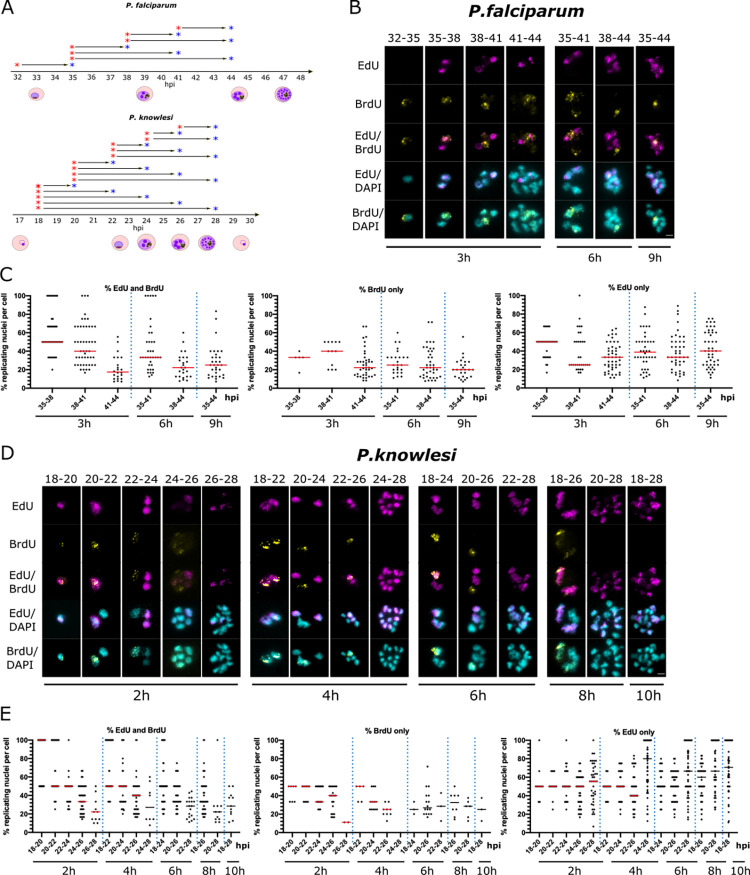
Fig 5. Gap phases lengthen across the course of schizogony.
A: Schematic of the timecourses shown in this figure. B,D: Representative examples of cells across double-labelled timecourses for P. falciparum (B) and P. knowlesi (D). P. falciparum was labelled at 3h intervals, up a maximum of 9h (35-44hpi); P. knowlesi at 2h intervals, up a maximum of 10h (18-28hpi). Scale bars all panels 2μm. C,E: Percentages of nuclear masses per cell labelled with EdU and BrdU, EdU alone, or BrdU alone throughout each timecourse. Dotted lines separate the datasets from different time-intervals. Medians are shown in red.

