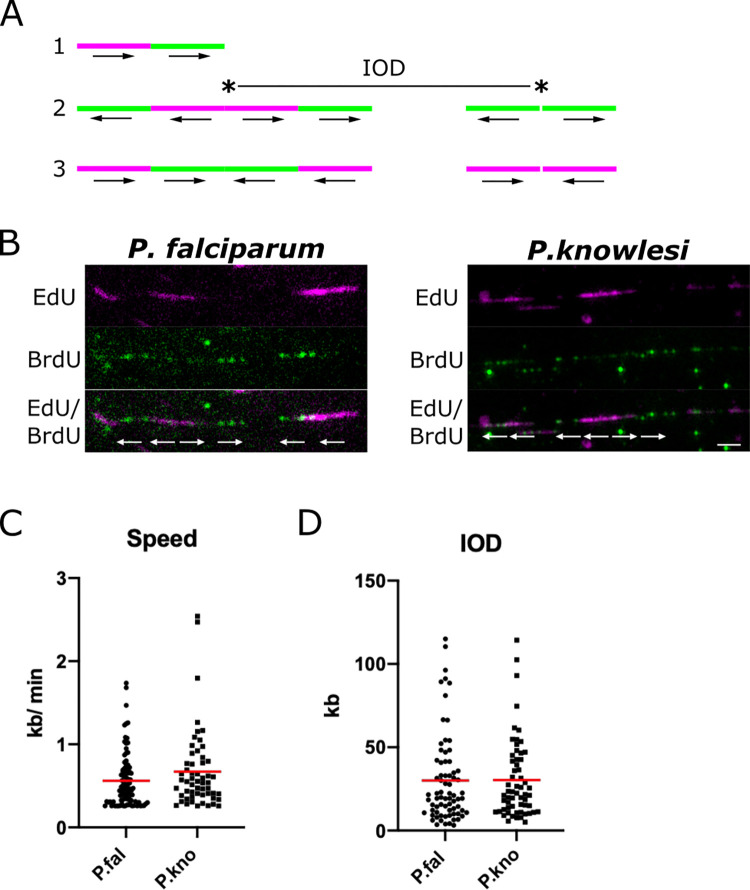
Fig 7. Single-molecule DNA replication dynamics in P. falciparum and P. knowlesi.
A: Schematic showing possible patterns of labelling on DNA fibres. Pattern 1 is an ongoing replication fork, moving throughout the two consecutive pulse-labels. Pattern 2 shows origins that fired during the first and second pulse labels, with inter-origin distance (IOD) measured as centre to centre distance between two adjacent origins. Pattern 3 shows two replication forks terminating during the first or second pulses. The presumed positions of the replication origins are indicated with asterisks in the middle of bidirectional replication forks. Arrows represent the direction of the replication forks’ progression. B: Representative DNA fibre spreads from P. falciparum and P. knowlesi. A 5kb scale bars is indicated. C: Dot plot showing distribution of replication fork speeds in P. falciparum and P. knowlesi, calculated on the basis of a 20-min pulse label (10 mins EdU, 10mins BrdU) and a stretching factor of 2.59kb/μm. Red bars represent the mean value. D: Dot plot showing distribution of inter-origin distances (IODs) in P. falciparum and P. knowlesi, calculated on the basis of a stretching factor of 2.59kb/μm. Red bars represent the mean value.

