. 2021 Dec 28;2(4):312–322. doi: 10.12336/biomatertransl.2021.04.007

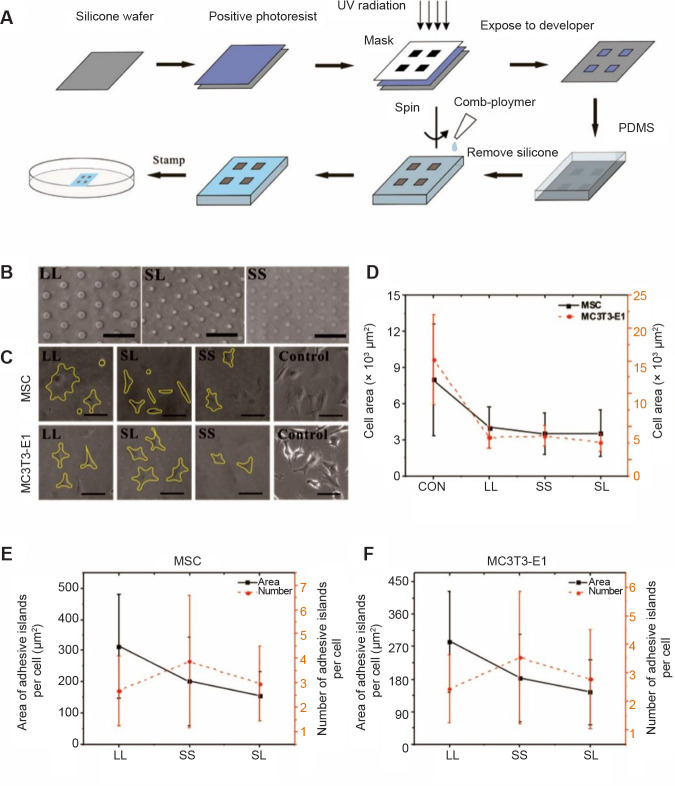
Figure 1. Micropatterned substrate and cell culture. (A) The process of micropatterning. (B) Bright-field images of micropatterned substrates. (C) Bright-field images of cells cultured on the micropatterned or blank substrates for 3 days. The yellow lines show the outline of the cells. The free-spreading cells showed polygons, while the spreading area of the patterned cells decreased. Scale bars: 50 μm. (D) Spread area at 3 days of cell culture. (E, F) Statistical analysis of the area and number of adhesive islands after 3 days of culture. Data are presented as mean ± SD (n = 3), and were analysed by one-way analysis of variance followed by Tukey’s post hoc analysis. CON: control (freely spreading group); LL: large circles with large spacing; MSC: mesenchymal stem cell; PDMS: polydimethylsiloxane; SL: small circles with large spacing; SS: small circles with small spacing; UV: ultraviolet.

Figure 1