. 2021 Dec 28;2(4):312–322. doi: 10.12336/biomatertransl.2021.04.007

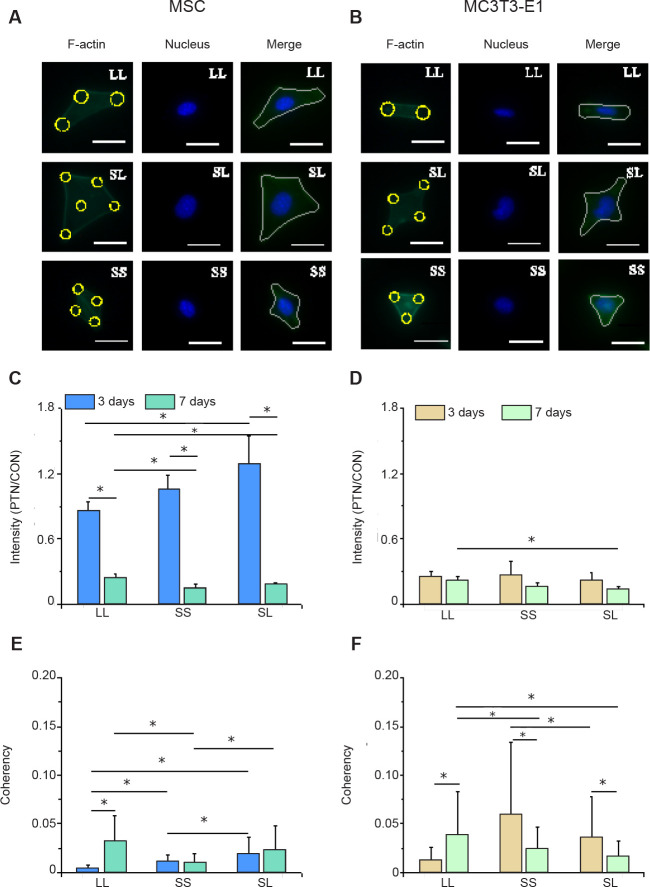
Figure 2. F-actin distribution in cells cultured on micropatterned substrates. (A, B) Fluorescent images of individual MSCs (A) and MC3T3-E1 cells (B) stained with phalloidin-labelled F-actin (green) with Hoechst 33342-stained nuclei (blue) at 3 days after seeding. Cells could be spread out into triangles, dumbbells, etc. The yellow circles represent the location of micropatterned islands. The gray shape represents the spreading shape of cells. Scale bars: 50 μm. (C, D) Statistical results of F-actin in MSCs (C) and MC3T3-E1 cells (D). (E, F) Statistical results of F-actin coherency in MSCs (E) and MC3T3-E1 cells (F). The larger the value, the more ordered the actin, and the more consistent the direction of stress fibres. Data are presented as mean ± SD (n = 3). *P < 0.05 (one-way analysis of variance followed by Tukey’s post hoc analysis). CON: control (freely spreading group); LL: large circles with large spacing; MSC: mesenchymal stem cell; PTN: pattern; SL: small circles with large spacing; SS: small circles with small spacing.

Figure 2