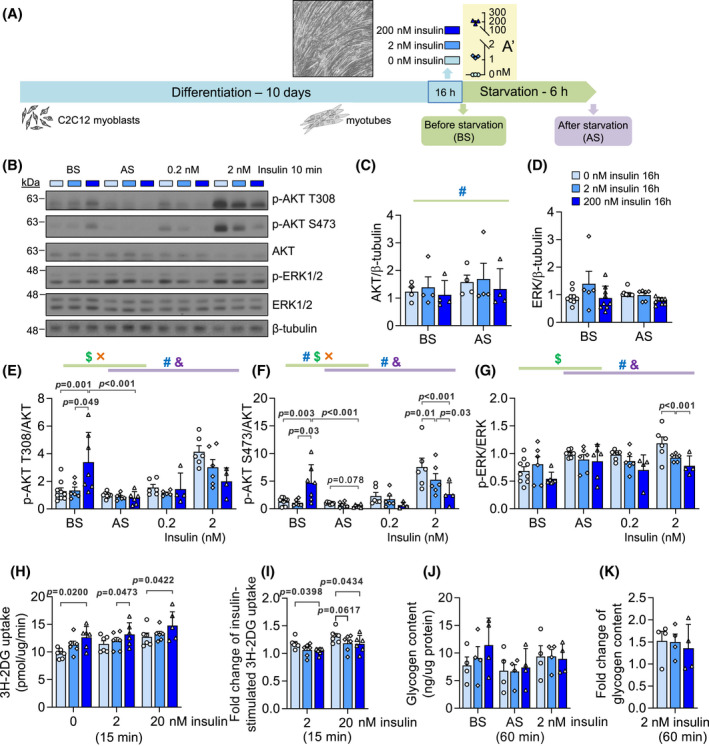
FIGURE 1.

Basal and acute insulin signaling in an in vitro hyperinsulinemia‐induced insulin resistance model. (A) The workflow of C2C12 myotube differentiation, high insulin treatment, and serum starvation. Differentiated myotubes were cultured in control (0 nM insulin) or hyperinsulinemic (2 or 200 nM insulin) medium for 16 h and were analyzed before and after serum starvation. (A') The insulin concentration in the medium at the end of 16‐h high insulin treatment (n = 3). (B) Representative western blot images of phospho‐AKT (T308, S473), total AKT, phospho‐ERK1/2, and total ERK1/2. (C) Total AKT and (D) total ERK abundance under high insulin treatments before starvation (BS) and after starvation (AS). (E) Phospho‐AKT (T308), (F) phospho‐AKT (S473) and (G) phospho‐ERK1/2 measurements before starvation (BS), after starvation (AS), and stimulated by 0.2 or 2 nM insulin for 10 min after serum starvation. (n = 6–9; #effect of hyperinsulinemia, $effect of starvation, &effect of acute insulin, ×interaction between two factors, Mixed Effect Model.) (H) The uptake of 2‐deoxy‐D‐glucose (2DG) under 0, 2, or 20 nM acute insulin for 15 min after serum starvation. (I) The insulin‐stimulated uptake of 2DG in response to 2 or 20 nM acute insulin for 15 min. (n = 6) (J) Glycogen content before starvation (BS), after starvation (AS), or after 60‐min 2 nM acute insulin treatment after starvation. (K) The fold change of glycogen content induced by 2 nM acute insulin compared to AS. (n = 4)
