FIGURE 7.

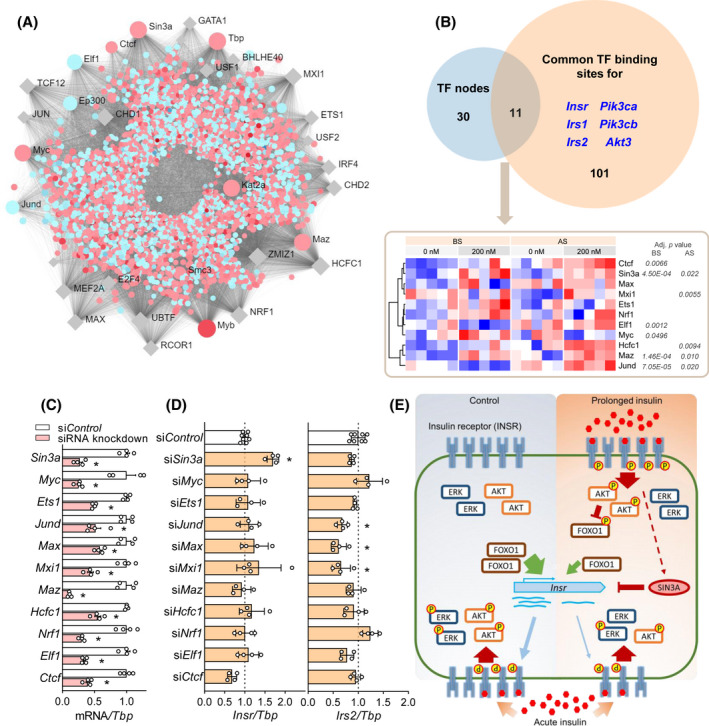
Identification of upstream transcription factors mediating the overall transcriptomic changes and insulin receptor expression. (A) Transcription factor (TF)‐gene network predicting upstream transcriptional regulators of differentially expressed genes by hyperinsulinemia (BS, 200 vs. 0 nM). Names of the top 30 TFs are labeled. Genes that are up or down‐regulated are shown in red or blue dots, respectively. TFs that are not differentially expressed are in grey rhombus. (B) Common TFs between the top 30 TF nodes from (A) and the TF binding sites for several key genes in insulin signaling pathways that are downregulated by hyperinsulinemia. Adjusted p values of differentially expressed TFs (200 vs. 0 nM, both BS and AS) are labeled next to the heatmap. (C) mRNA levels of the common TFs in (B) after siRNA knockdown. (D) The effects of each siRNA knockdown on Insr and Irs2 mRNA levels. (n = 4. *p < .05, 1‐ANOVA followed by Dunnett multiple comparison test against siControl.) (E) Graphic summary of our current model. Hyperinsulinemia induced sustained phosphorylation of INSR and AKT, which resulted in the inhibition of FOXO1 leading to reduced Insr transcription. Downregulated INSR and post‐receptor components resulted in reduced insulin signaling upon acute insulin stimulation. SIN3A, which was upregulated by hyperinsulinemia, represses Insr transcription
