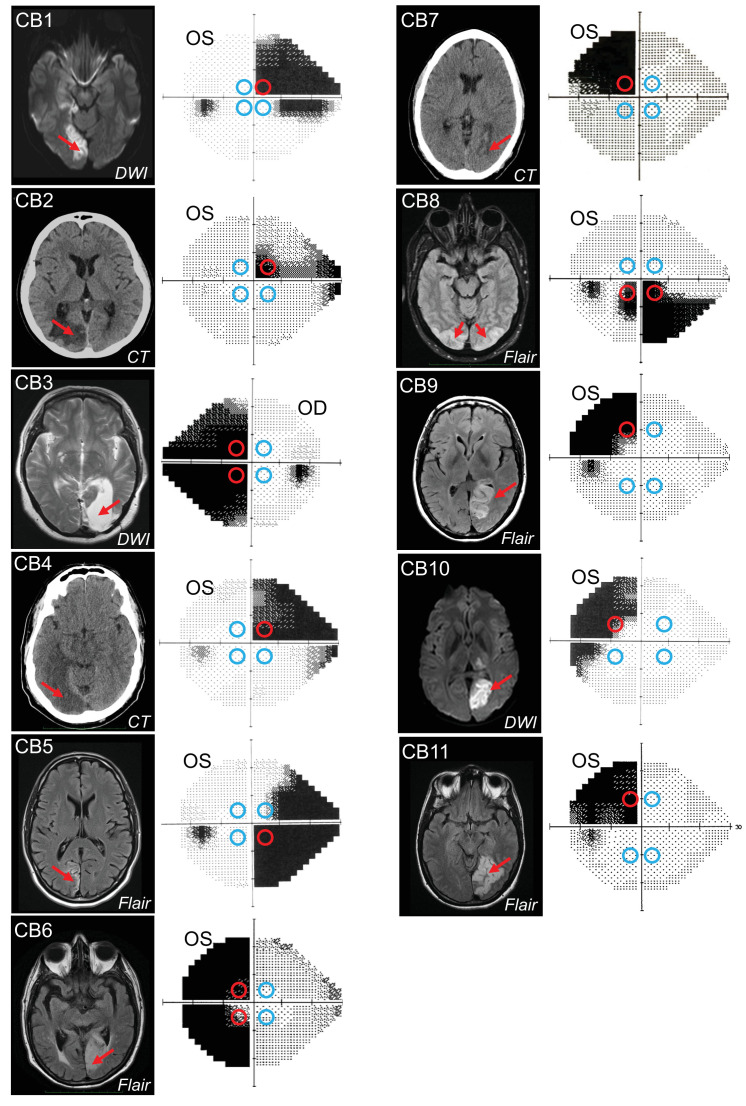
Figure 1. Occipital lesions, Humphrey visual field maps, and post-saccadic following response (PFR) testing locations.
Single radiographic images through the brains of each V1-stroke participant (N=11), illustrating region(s) of occipital damage (red arrows), shown with right brain hemispheres on image right. The location, size, and shape of visual stimuli presented during the PFR testing protocol are indicated by colored circles superimposed on initial 24-2 Humphrey visual field maps acquired for the tested eye in each case. Red circles: blind field testing locations; blue circles: intact field locations; OS: left eye; OD: right eye; DWI: diffusion-weighted imaging; FLAIR: T2-weighted fluid-attenuated inversion recovery; CT: computed tomography.

