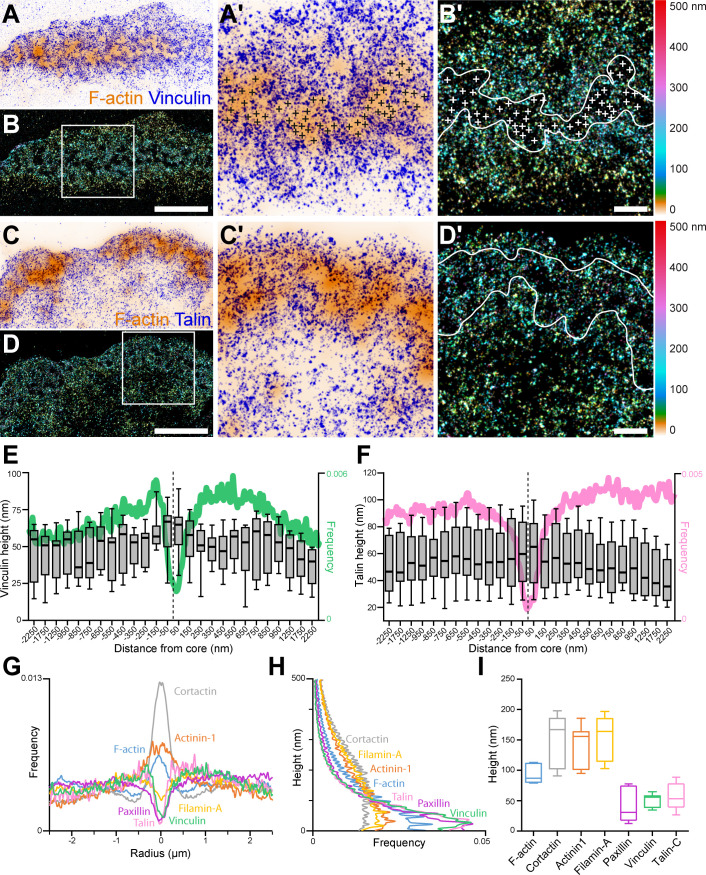
Figure 1. 3D nanoscopy of vinculin and talin-C in the osteoclast podosome belt.
(A) Representative dSTORM images of vinculin (blue) merged with the corresponding epifluorescence images of the F-actin cores (ochre). (A’) Enlarged view of (A). The white crosses indicate the localization of actin cores. (B) DONALD images corresponding to (A) where the height is represented in false color (scale shown in B’). (B’) Enlarged view of (B). The white crosses indicate the localization of actin cores. (C) Representative dSTORM images of talin-C (blue) merged with the corresponding epifluorescence images of the F-actin cores (ochre). (C’) Enlarged view of (C). (D) DONALD images corresponding to (A) where the height is represented in false color (scale shown in (D’)). (D’) Enlarged view of (D). (E–F) Height profiles for vinculin (E) and talin-C (F) and radial distributions (in green and pink, respectively) with respect to the distance to the center of the podosome belt. Data from 465 cores and 1235 cores were quantified for vinculin and talin-C graphs, respectively. (G–H) Radial (G) and vertical (H) distributions of cortactin, α-actinin1, filamin A, paxillin, vinculin, and talin-C in podosome belts. (I) Median axial positions of F-actin, cortactin, α-actinin1, filamin A, paxillin, vinculin, and talin-C in podosome belts. Box-and-whisker plots show the median, lower and upper quartiles (box) and the 10th and 90th percentiles (whiskers). Scale bars: 5 µm (A–D), 1 µm (B’, D’).


