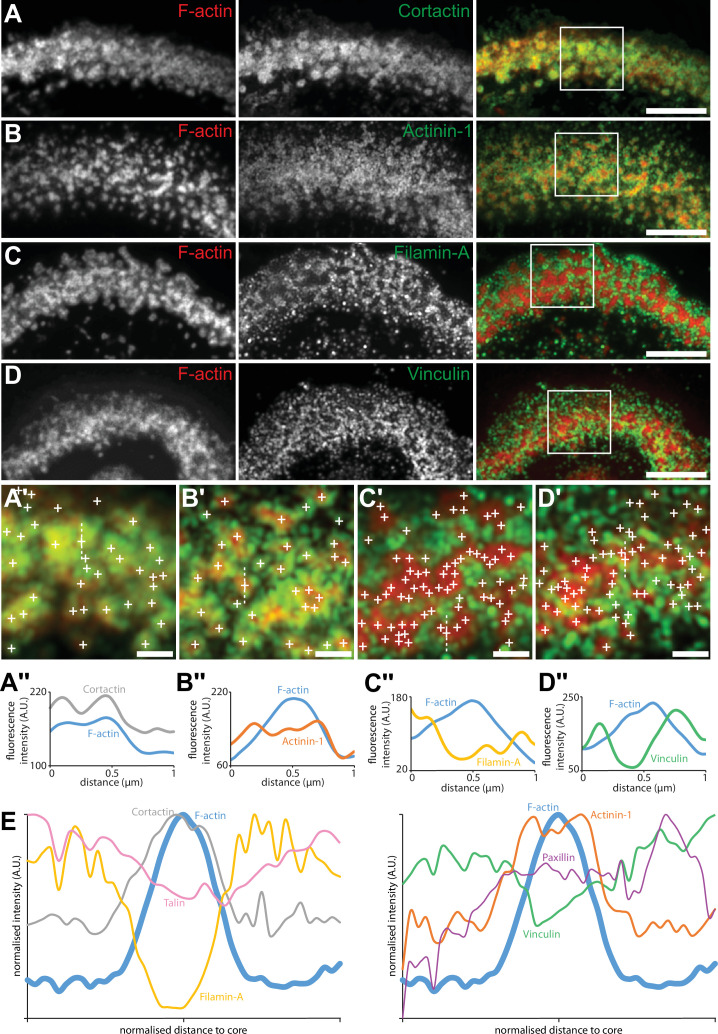
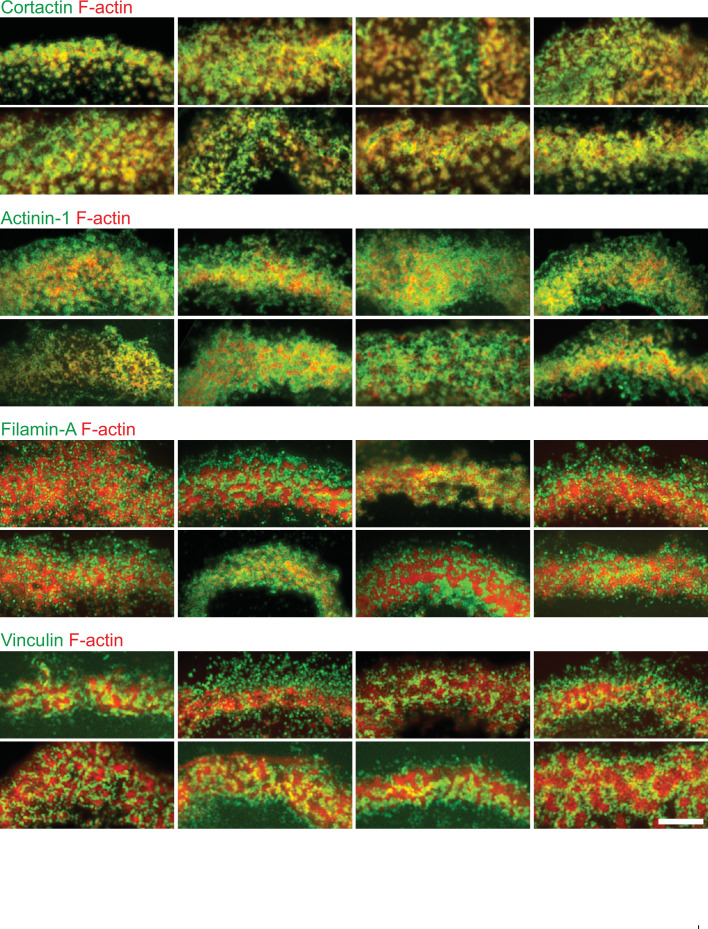
Figure 4. Localization in the sealing zone of actin core and ring proteins.
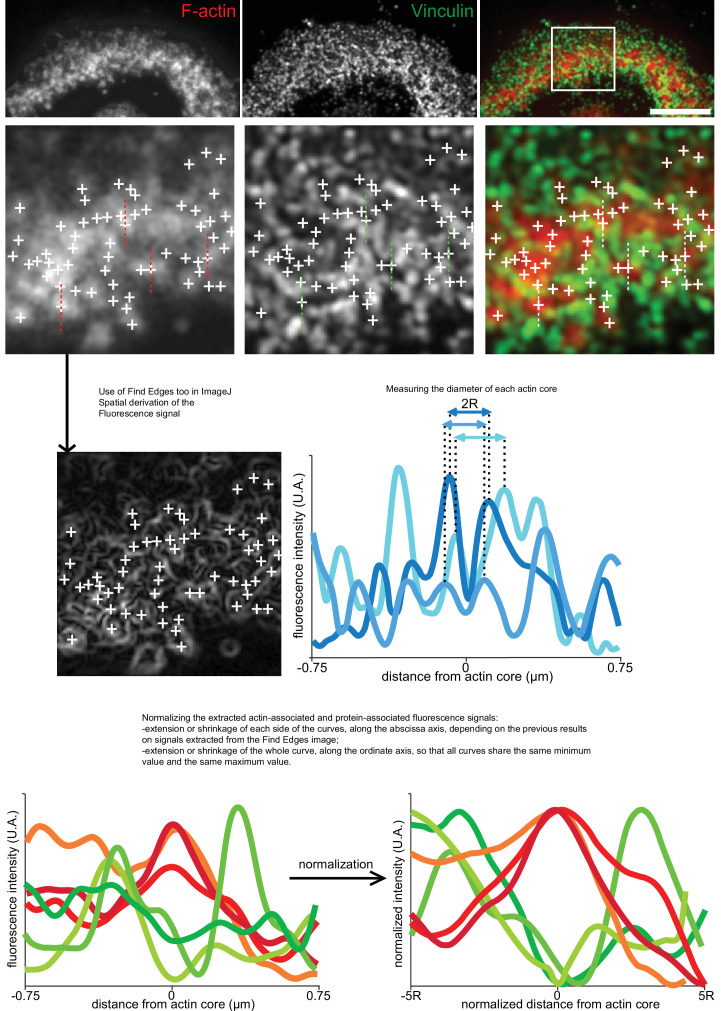
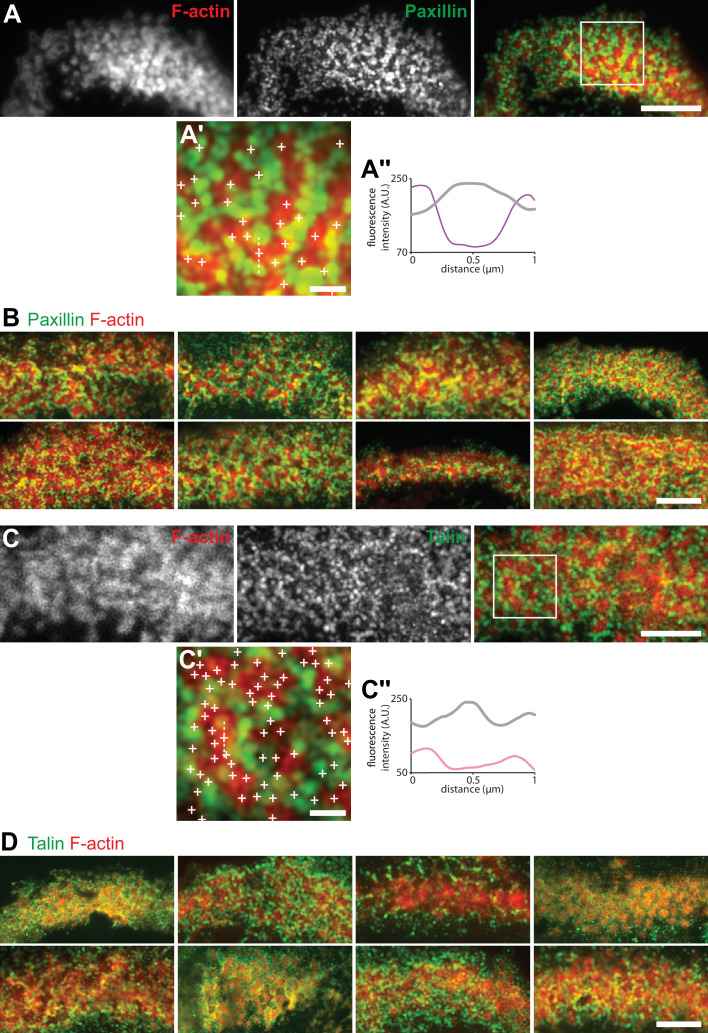
(A) Representative RIM images of sealing zones co-stained for F-actin (red) and cortactin (green). (A’) Enlarged view of (A) where white crosses indicate the localization of actin cores. (A’’) Intensity profiles along the dotted line marked in (A’). (B) Representative RIM images of sealing zones co-stained for F-actin (red) and α-actinin1 (green). (B’) Enlarged view of (B) where white crosses indicate the localization of actin cores. (B’’) Intensity profiles along the dotted line marked in (B’). (C) Representative RIM images of sealing zones co-stained for F-actin (red) and filamin A (green). (C’) Enlarged view of (C) where white crosses indicate the localization of actin cores. (C’’) Intensity profiles along the dotted line marked in (C’). (D) Representative RIM images of sealing zones co-stained for F-actin (red) and vinculin (green). (D’) Enlarged view of (D) where white crosses indicate the localization of actin cores. (D’’) Intensity profiles along the dotted line marked in (D’). (E) Normalized intensity profiles of F-actin, cortactin, α-actinin1, filamin A, vinculin, paxillin, and talin (medians of 1080, 239, 265, 277, 299, 197 and 988 cores for each staining, respectively). Scale bars: 5 µm (A, B, C, D), 1 µm (A’, B’, C’, D’).


