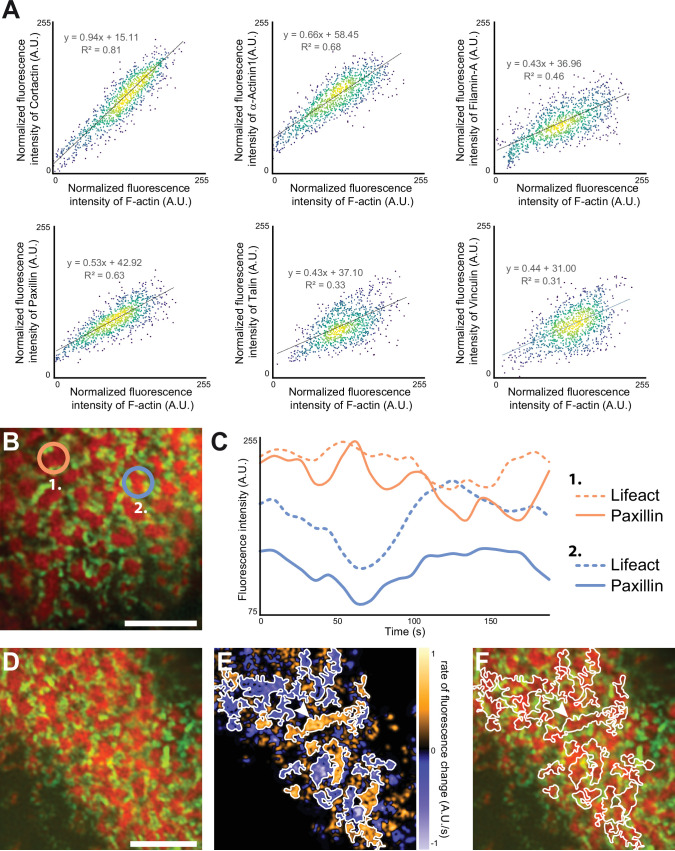
Figure 5. Quantification of the dynamics of the sealing zone.
(A) Osteoclasts adhering to bone were stained for both F-actin and cortactin, α-actinin1, filamin A, vinculin, talin, or vinculin, respectively. The intensity of each fluorescent marker in 1 µm radius circles around F-actin cores were quantified for at least 1000 cores (in five cells from different donors), and correlated to the fluorescence intensity of F-actin. Data were normalized with respect to the maximum intensity. (B–C) Time-lapse RIM imaging of F-actin and paxillin in a living osteoclast expressing LifeAct-mCh and paxillin-GFP and adhering to bone. (C) The intensity variations of LifeAct-mCh and paxillin-GFP from two cores marked in (B) are shown. Note that the variations of the two podosome markers are correlated locally, but that the two cores, which are 5 µm apart, are not synchronized (C). (D) Time-lapse RIM imaging of F-actin and paxillin in a living osteoclast expressing LifeAct-mCh and paxillin-GFP and adhering to bone. A single RIM image of paxillin was acquired, followed by a stream acquisition of LifeAct-GFP, for a higher temporal resolution. (E) Image of the rate of fluorescence change corresponding to the cell shown in (D). (F) The superposition of the fluorescence image and the segmentation of clusters of synchronized areas in the sealing zone shows that there is a synchrony within zones corresponding to multiple cores encircled by paxillin. The arrowheads in (E–F) indicate a large cluster of actin cores. Note that all the different cores in this group are synchronized (in orange, E). Scale bars: 5 µm.

