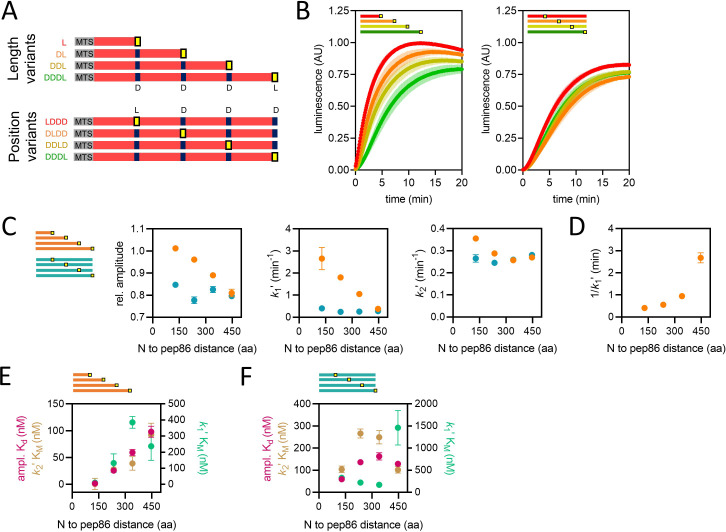
Figure 3. Using proteins of varying lengths to elucidate import kinetics.
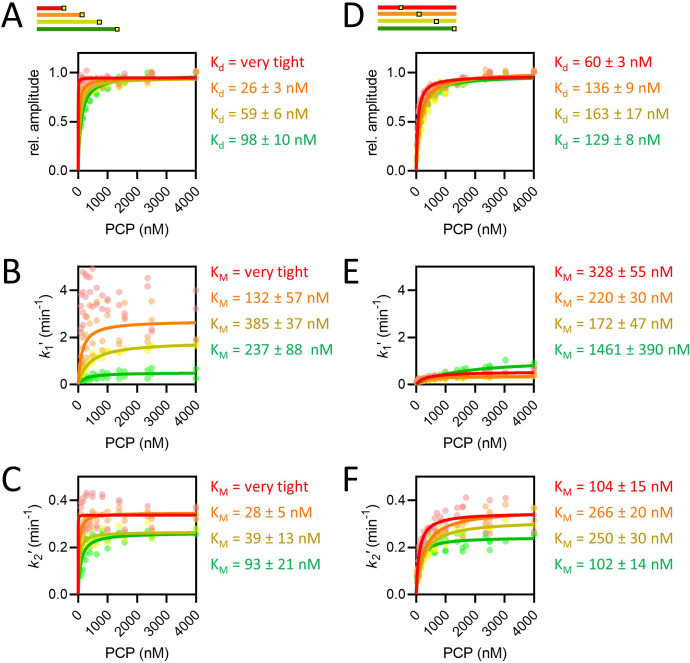
(A) Schematic of two protein series (length variants and position variants), with native mitochondrial targeting sequence (MTS) and mature part of Acp1 in grey and red, respectively, pep86 in yellow (L for live) and scrambled pep86 in dark blue (D for dead, i.e., it does not complement 11S). (B) Examples of import traces for length variants (left panel) and position variants (right panel). Error bars shown partially transparent in the same colours as the main traces. Those smaller than the main trace are not shown. SD from biological triplicate, each conducted in duplicate. (C) Parameters obtained from two-step fits to the data shown in panel B. The length variant series is shown in orange and the position variant series in teal. Error bars show SEM from three independent biological experiments, each conducted in duplicate. Error bars smaller than symbols are not shown. (D) Reciprocal of k1′ as a function of PCP length (same data as in panel C) – the time constant for that step – for the length variants. (E) The concentration dependence of length variants. Secondary data from import assays with varying concentrations of length series proteins (four to six independent biological replicates) were fitted to the Michaelis-Menten equation, from which apparent Kds and KMs are derived. Error represents the SEM of this fitting. (F) As in panel E but with the position variant proteins.


