. 2022 Jun 8;11:e75426. doi: 10.7554/eLife.75426

Figure 4. Effects of energy depletion on import of the length and position variants.

(A) Import in the presence (solid circles) or absence (open circles) of ∆ψ, for the length (orange) and position (teal) series. Depletion of ∆ψ was achieved by a 5-min pre-treatment of mitochondria with 10 nM valinomycin. Plots show amplitude (left), k1′ (middle), and k2′ (right) extracted from two-step fits to import traces as a function of PCP length or pep86 position. Each point is the average and SEM of three independent biological replicates. (B) As in panel A, but without (solid circles) or with (open circles) ATP depletion instead of valinomycin. Matrix ATP was depleted by excluding ATP and its regenerating system from the assay mix (see Results section for full description).

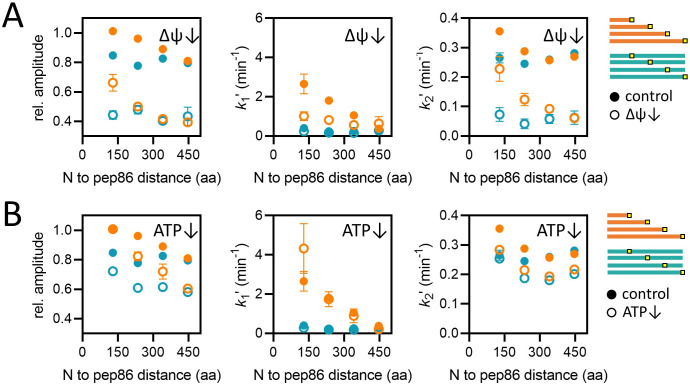
Figure 4—source data 1. Numerical primary (luminescence) and secondary (amplitudes) data corresponding to the graphs in panel A.
elife-75426-fig4-data1.xlsx (127.3KB, xlsx)
Figure 4—source data 2. Numerical primary (luminescence) and secondary (amplitudes) data corresponding to the graphs in panel B.
elife-75426-fig4-data2.xlsx (126.1KB, xlsx)

Figure 4.

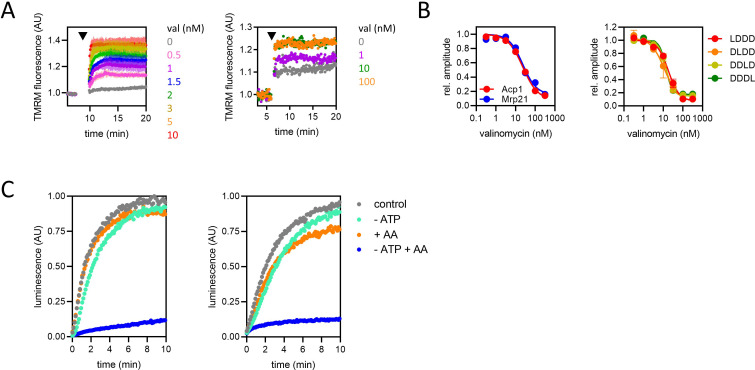
Figure 4—figure supplement 1. The effect of valinomycin (val) on ∆ψ and protein import, and confirmation of ATP depletion in the mitochondrial matrix.

Figure 4—figure supplement 1.

(A) Tetramethylrhodamine methyl ester (TMRM) fluorescence over time in isolated yeast mitochondria with val added at the time indicated by arrowhead, at final concentrations of 0.5–10 nM in the left graph and up to 100 nM in the graph on the right (demonstrating saturation of the effect). In the left graph, data are the mean ± SD from three biological repeats. The data in the right graph are representative of three biological repeats. Note that the relationship between TMRM fluorescence and ∆ψ is not linear, so there will be some residual membrane potential even when the effect saturates (at ~10 nM val). (B) Amplitude of luminescence traces from the import of Acp1 and Mrp21 (left panel) and position variant proteins (right panel), into mitochondria pre-treated for 5 min with val at a range of concentrations. The data in the left panel are representative of three biological repeats. The data in the right panel are the mean ± SEM of three biological repeats. (C) Import traces for 1 µM Acp1-pep86 (left) and Mrp21-pep86 (right) in the presence (grey and orange symbols) or absence (turquoise and blue symbols) of ATP and its regenerating system, and the absence (grey and turquoise) or presence (orange and blue) of antimycin A (AA).
Figure 4—figure supplement 1—source data 1. Numerical data corresponding to the graphs in panel A.
Figure 4—figure supplement 1—source data 2. Primary (luminescence) and secondary (amplitude) data corresponding to the graphs in panel B.
Figure 4—figure supplement 1—source data 3. Numerical luminescence data corresponding to the traces shown in panel C.