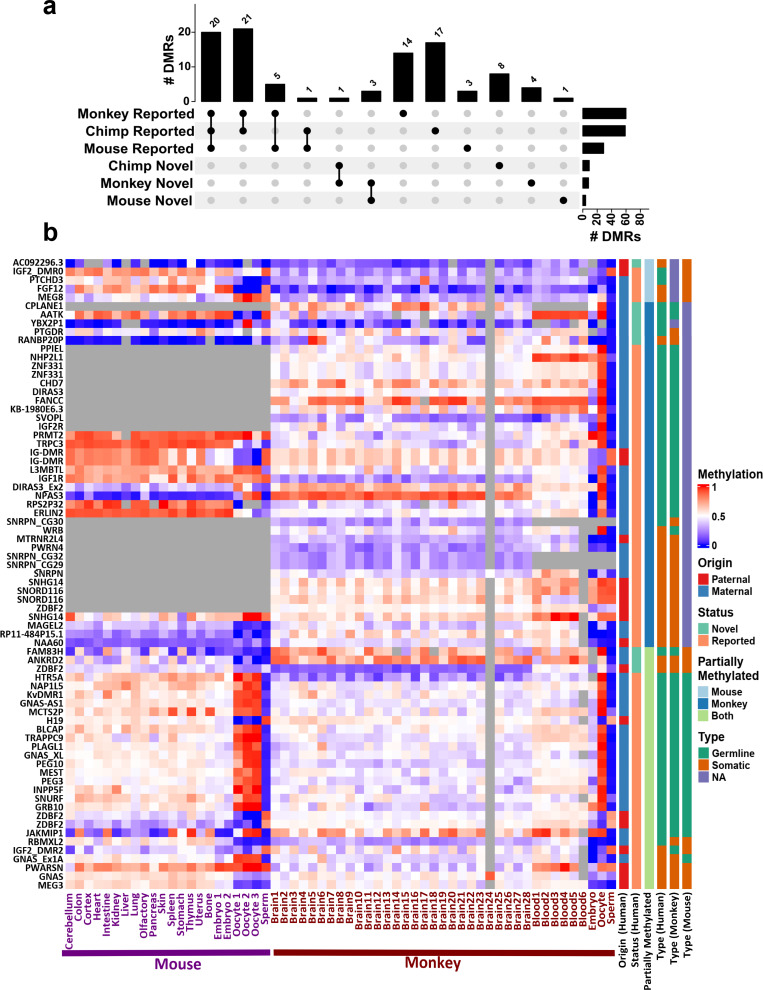
Figure 5. Conservation of detected differentially methylated regions (DMRs).
(a) Upset plot representing the number of previously reported and novel DMRs with evidence of conservation (partial methylation) in each of the mammals. (b) Heatmap representing human DMRs (DMR names on the left) and average methylation of their orthologous intervals in mouse and macaque in different tissues and also in sperm, oocyte, and embryonic samples. Gray regions represent NA values that either did not have an ortholog or enough CpG in the whole-genome bisulfite sequencing (WGBS) data.

