. 2022 Jul 5;11:e77898. doi: 10.7554/eLife.77898

Figure 6. IGV screenshots of two novel somatic differentially methylated regions (DMRs).

(a) Novel maternally methylated somatic DMR overlapping with the promoter of paternally expressed ZNF714 gene. (b) Novel paternally methylated somatic DMR overlapping with the promoter of maternally expressed PAX8-AS1gene. Highlighted box regions represent the DMRs. Parent-of-origin (PofO) allele-specific expression (ASE) track is created using publicly available ASE data from Zink et al., 2018 (see Materials and methods). Positive vertical bars (upward) represent paternal expression and negative bars (downward) represent maternal expression. The range for all methylation tracks is 0–1.

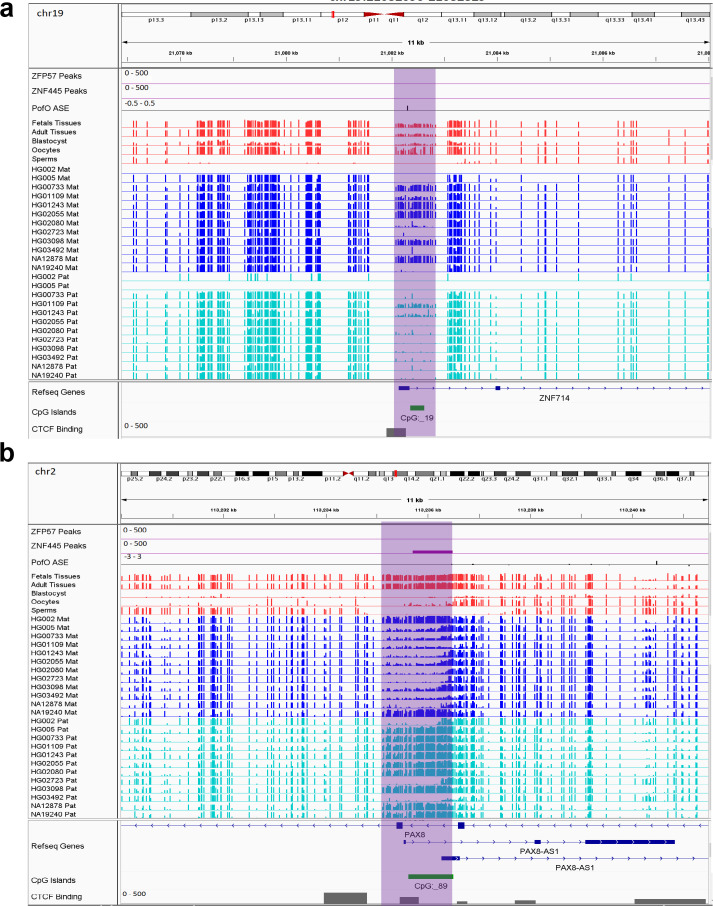
Figure 6.

Figure 6—figure supplement 1. Novel somatic paternally methylated differentially methylated region (DMR) in paternally expressed ZDBF2 gene.

Figure 6—figure supplement 1.

The range for all methylation tracks is 0–1. In parent-of-origin (PofO) ASE track, positive or upward bars represent paternal expression bias and negative or downward bars represent maternal expression bias.
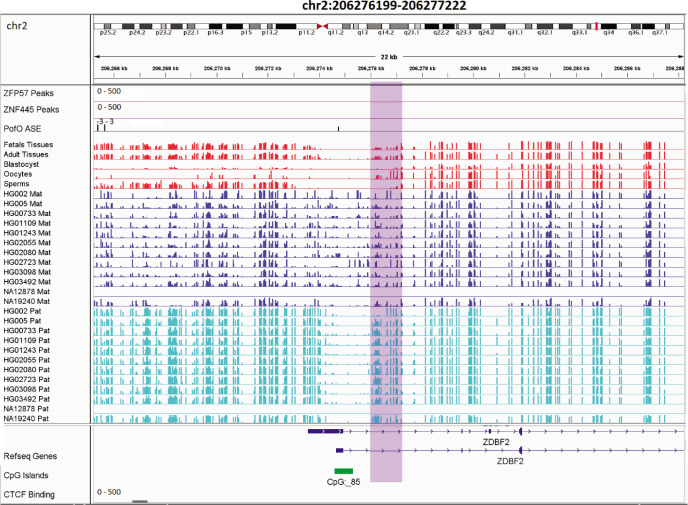
Figure 6—figure supplement 2. Novel somatic maternally methylated differentially methylated region (DMR) in maternally expressed RB1 gene and isoform dependent (or in some studies paternally) expressed LPAR6 gene.

Figure 6—figure supplement 2.

The range for all methylation tracks is 0–1. In parent-of-origin (PofO) ASE track, positive or upward bars represent paternal expression bias and negative or downward bars represent maternal expression bias.
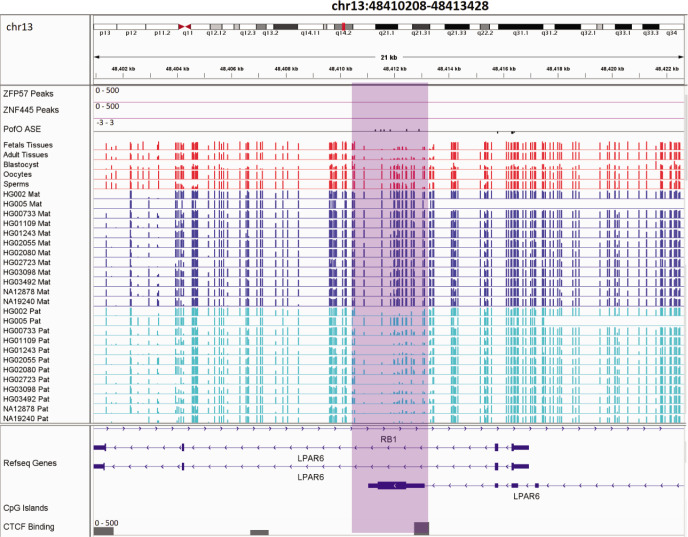
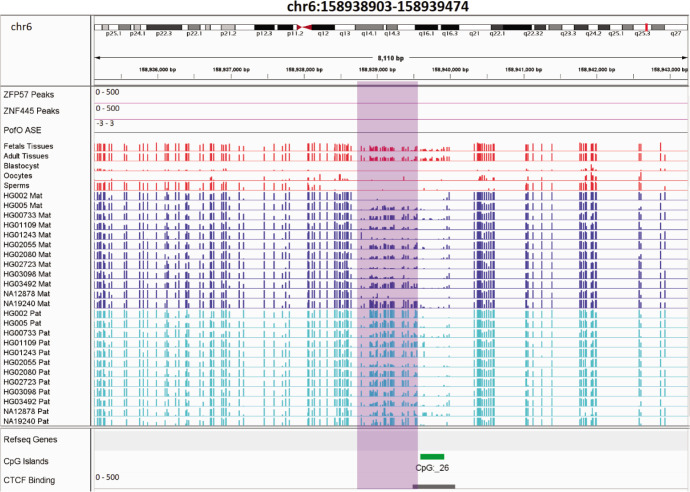
Figure 6—figure supplement 3. Novel somatic maternally methylated differentially methylated region (DMR) in paternally expressed BMP8A gene.

Figure 6—figure supplement 3.

The range for all methylation tracks is 0–1. In parent-of-origin (PofO) ASE track, positive or upward bars represent paternal expression bias and negative or downward bars represent maternal expression bias.
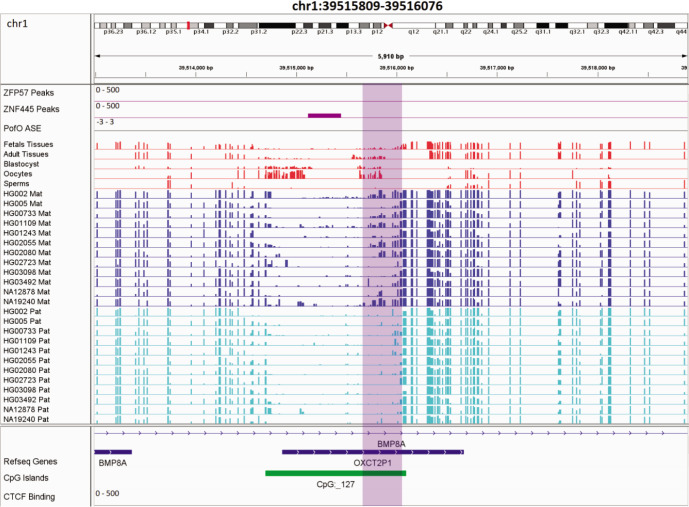
Figure 6—figure supplement 4. Novel somatic paternally methylated differentially methylated region (DMR) 3 kb away from paternally expressed PWAR1 gene.

Figure 6—figure supplement 4.

The range for all methylation tracks is 0–1. In parent-of-origin (PofO) ASE track, positive or upward bars represent paternal expression bias and negative or downward bars represent maternal expression bias.
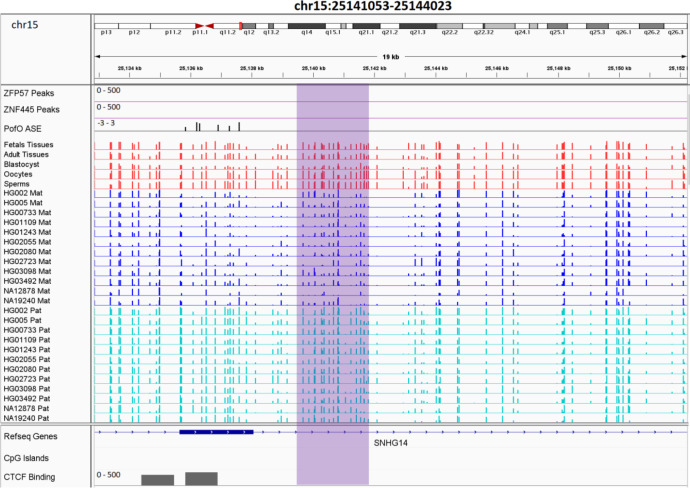
Figure 6—figure supplement 5. Novel somatic paternally methylated differentially methylated region (DMR) 90 kb away from maternally expressed LINC00665 gene.

Figure 6—figure supplement 5.

The range for all methylation tracks is 0–1. In parent-of-origin (PofO) ASE track, positive or upward bars represent paternal expression bias and negative or downward bars represent maternal expression bias.
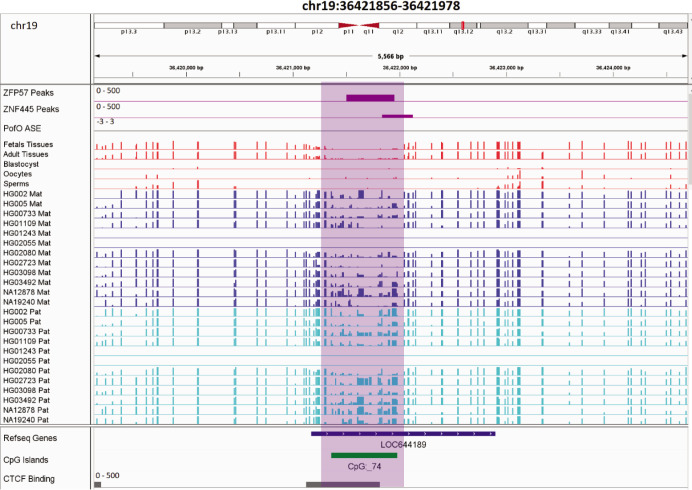
Figure 6—figure supplement 6. Novel somatic paternally methylated differentially methylated region (DMR) 296 kb away from randomly/maternally expressed DGCR6 gene.

Figure 6—figure supplement 6.

The range for all methylation tracks is 0–1. In parent-of-origin (PofO) ASE track, positive or upward bars represent paternal expression bias and negative or downward bars represent maternal expression bias.
Figure 6—figure supplement 7. Novel somatic paternally methylated differentially methylated region (DMR) 1.03 Mb away from maternally expressed IGF2R.

Figure 6—figure supplement 7.

The range for all methylation tracks is 0–1. In parent-of-origin (PofO) ASE track, positive or upward bars represent paternal expression bias and negative or downward bars represent maternal expression bias.