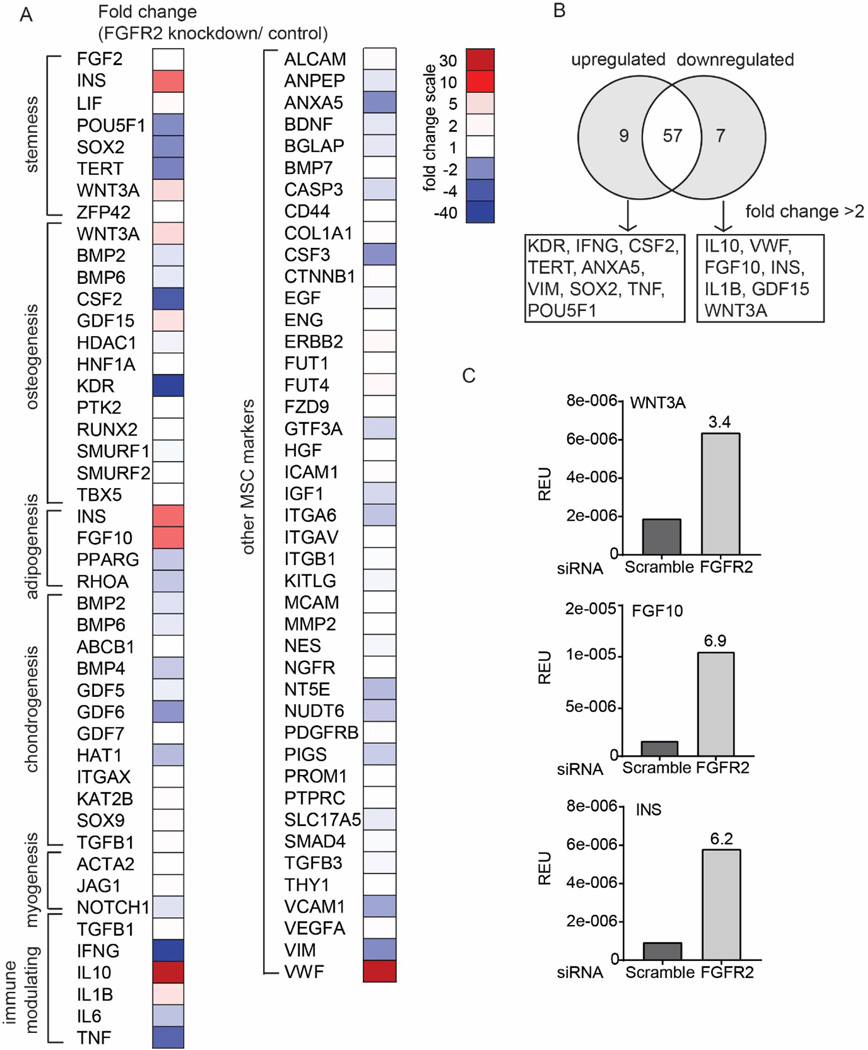
Figure 4.
Gene expression profile of FGFR2 siRNA-transfected cells cultured in maintenance media in comparison to control scrambled siRNA-transfected cells from a single experiment. A) Heatmap summarizing the relative fold-change in gene expression (FGFR2 siRNA/scramble control siRNA). Gene function clustering was according to manufacturer’s guide with modification based on established studies from literature. B) Venn diagram showing genes affected by FGFR2 knockdown (fold change >2). C) Bar graph depicts relative gene expression (normalized to actin) for transcripts related to osteogenesis and adipogenesis. The number on the bar chart showed fold change (FGFR2 siRNA/scramble control siRNA).

