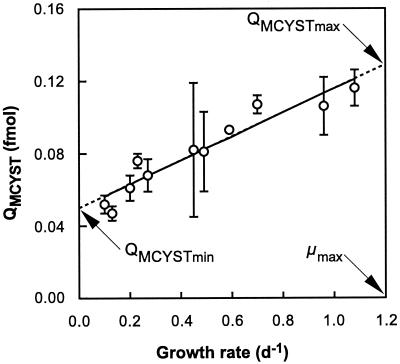
FIG. 1.
Cellular QMCYST of M. aeruginosa grown in N-limited chemostats. Error bars represent standard errors of the means of triplicate chemostat cultures. The solid line shows cell quotas predicted from experimental growth rates (r = 0.952) using equation 1 (see text), and the dashed line represents the extrapolation of this relationship to μmax (where QMCYST = QMCYSTmax) and μ = 0 (where QMCYST = QMCYSTmin). d, day.

