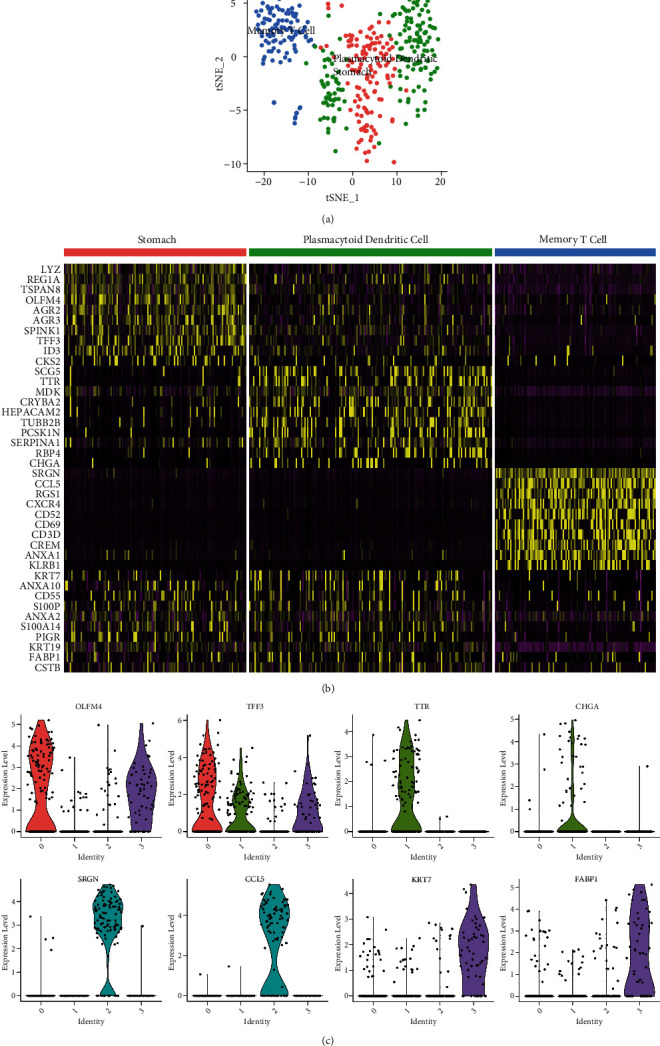
Figure 3.

The cell annotation and differentially expressed genes (DEGs) identification. (a) The cell annotation results were presented by tSNE map based on the scCATCH algorithm. (b) The DEGs among the different cell clusters are shown in the heatmap. (c) The expression levels of primarily DEGs in different cell clusters.
