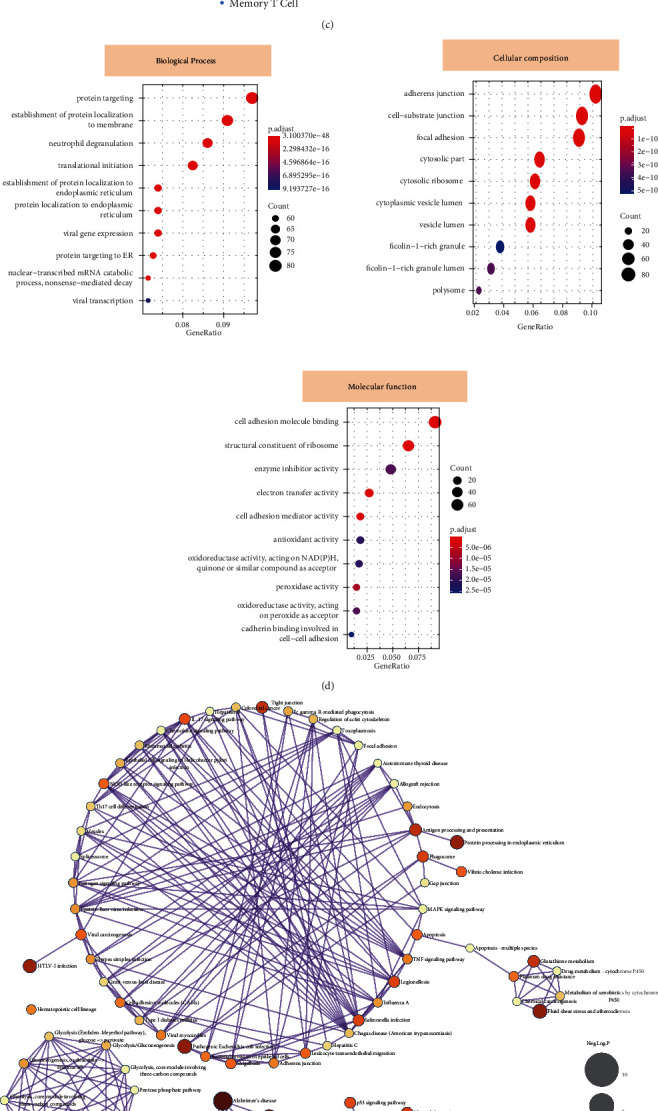
Figure 4.

The pseudo-time-related differentially expressed genes (DEGs) detection and enrichment analysis of biological functions. After selecting the appropriate cell principal components (a), the pseudo-time analysis was applied based on the monocle algorithm (b, c). (d) The analysis results presented the GO functional analysis results of biological processes (BP), cellular components (CC), and molecular functions (MF), respectively. (e) The results of the KEGG pathway enrichment analysis. The nodes' size represented the negative log10 p value for illustrative purposes. (f) The volcano plot showed the differentially expressed genes in pseudo-time analysis. (g) The compartmentalized protein-protein interaction of FABP1 was constructed based on the COMPPI database.
