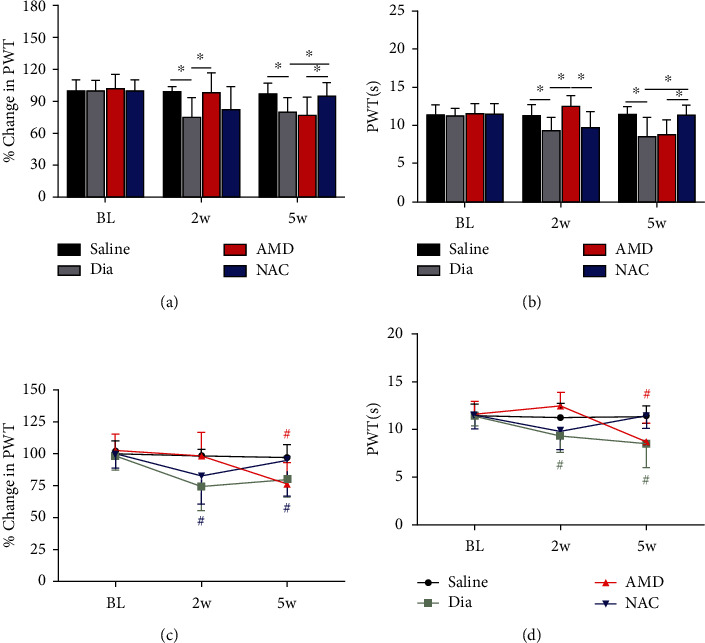
Figure 5.

Variations of PWT (a) and PWL (b) in untreated diabetic rats (Dia) and in nondiabetic control (saline) or diabetic rats exposed to treatment with AMD or NAC and variations of PWT (c) and PWL (d) from baseline in the saline, Dia, AMD, or NAC group. PWT (a) and PWL (b) were notably decreased in STZ-induced diabetic rats and increased in AMD-treated diabetic rats but not in NAC-treated diabetic rats at 2 weeks, while PWT and PWL were significantly increased in diabetic rats receiving oral NAC by 5 weeks as identified by electronic Von Frey and Hargreaves test. In addition, PWT (c) and PWL (d) were reduced from 2 weeks to 5 weeks compared to baseline in Dia group, and PWT (c) and PWL (d) were obviously lowered in 5 weeks in comparison with baseline in the AMD group. All findings are shown to be means ± SD, n = 6/group, ∗P < 0.05. #P < 0.05 vs. baseline. BL = baseline; w = week; PWT = paw withdraw threshold; PWL = paw withdrawal latencies; Dia = diabetes; NAC = N-acetyl-L-cysteine; AMD = AMD3100.
