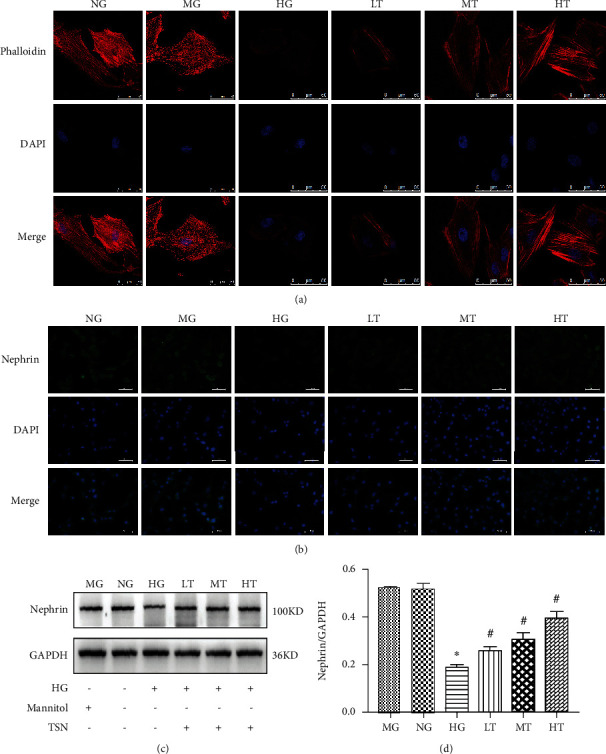
Figure 4.

Effects of TSN on nephrin expression and podocyte cytoskeleton in high glucose-induced podocytes. (a) Staining of podocytes cytoskeleton with phalloidin, original magnification ×630, scale 50 μm, n = 3. (b) Representative immunofluorescence photographs of nephrin in each group, magnification ×400, scale 50 μm, n = 3. (c–d) Representative Western blot band and quantification of nephrin protein expression in each group, data were shown as the mean ± SD, n = 3; ∗P < 0.05 versus the NG group, #P < 0.05 versus the HG group.
