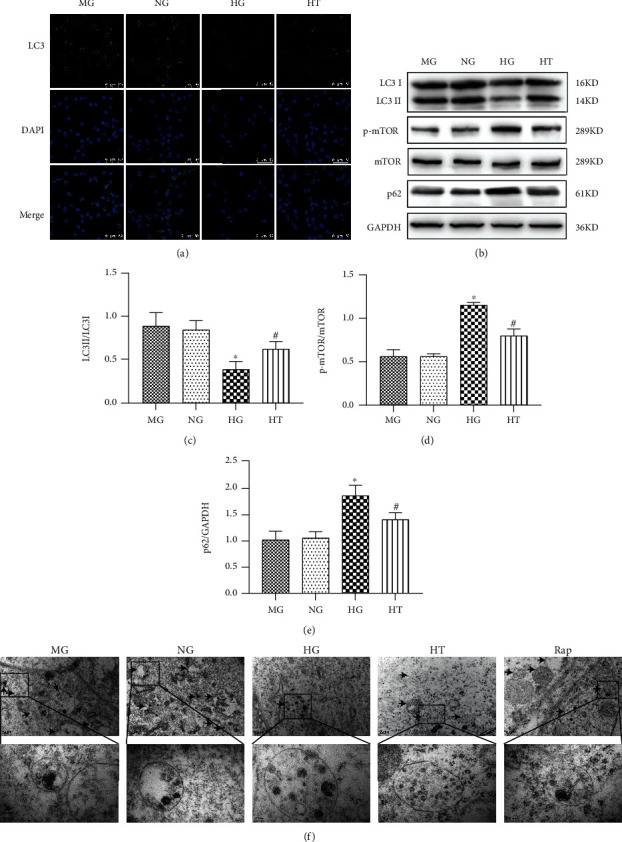
Figure 5.

Effect of TSN on the autophagic activity of high glucose-induced podocytes. (a) Representative immunofluorescence photographs (magnification ×630) of LC3II in each group (n = 3). Scale bar =50 μm. (b–e) Representative Western blot bands and quantification of LC3II/I, p-mTOR, mTOR, and P62 protein expression. Data were shown as mean ± SD, n = 3; ∗P < 0.05 versus the NG group, #P < 0.05 versus the HG group. (f) Electron microscope observation showed that the number of autophagosomes decreased under high glucose conditions, and TSN treatment could improve it. The scales and magnifications are 0.2 μm and ×6000 for the upper picture and 100 nm and ×20000 for the lower picture.
